Download
1 / 23
230 likes | 310 Views
A Spectral Clustering Approach to Optimally Combining Numerical Vectors with a Modular Network. Motoki Shiga, Ichigaku Takigawa, Hiroshi Mamitsuka Bioinformatics Center, ICR, Kyoto University, Japan. KDD 2007, San Jose, California, USA, August 12-15 2007. 1. Table of Contents.

E N D
A Spectral Clustering Approach to Optimally Combining Numerical Vectors with a Modular Network Motoki Shiga, Ichigaku Takigawa, Hiroshi Mamitsuka Bioinformatics Center, ICR, Kyoto University, Japan KDD 2007, San Jose, California, USA, August 12-15 2007 1
Table of Contents • MotivationClustering for heterogeneous data(numerical + network) • Proposed method Spectral clustering (numerical vectors + a network) • ExperimentsSynthetic data and real data • Summary 2
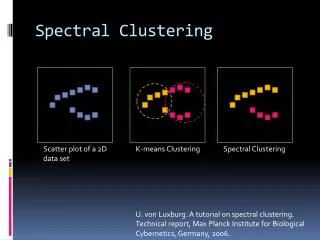
Heterogeneous Data Clustering Heterogeneous data : various information related to an interest Ex.Gene analysis: gene expression, metabolic pathway, …, etc. Web page analysis : word frequency, hyperlink, …, etc. Numerical Vectors k-means SOM, etc. Gene expression #experiments = S S-th value Gene 1 … 3 To improve clustering accuracy, combine numerical vectors + network 2 1st expression value metabolicpathway 5 4 Network Minimum edge cut Ratio cut, etc. 7 6 3 M. Shiga, I. Takigawa and H. Mamitsuka, ISMB/ECCB2007.
Related work : semi-supervised clustering ・Local property Neighborhood relation -must-link edge, cannot-link edge ・Hard constraint (K. Wagstaff and C. Cardie, 2000.)・Soft constraint(S. Basu etc., 2004.) - Probabilistic model (Hidden Markov random field) Proposed method ・Global property(network modularity) ・Soft constraint -Spectral clustering 4
Table of Contents • MotivationClustering for heterogeneous data(numerical + network) • Proposed method Spectral clustering (numerical vectors + a network) • ExperimentsSynthetic data and real data • Summary 5
Spectral Clustering L. Hagen, etc., IEEE TCAD, 1992., J. Shi and J. Malik, IEEE PAMI, 2000. 1. Compute affinity(dissimilarity) matrix M from data 2. To optimize cost J(Z) = tr{ZTMZ} subject to ZTZ=I where Z(i,k) is 1 when node i belong to cluster k, otherwise 0, Trace optimization compute eigen-values and -vectors of matrix M by relaxing Z(i,k) to a real value e2 Each node is by one or more computed eigenvectors Eigen-vector e1 3. Assign a cluster label to each node ( by k-means ) 6
Cost combining numerical vectors with a network network Cost of numerical vector cosine dissimilarity What cost? N : #nodes, Y : inner product of normalized numerical vectors To define a cost of a network, use a property of complex networks 7
Complex Networks Ex. Gene networks, WWW, Social networks, …, etc. • Property • Small world phenomena • Power law • Hierarchical structure • Network modularity Ravasz, et al., Science, 2002. Guimera, et al., Nature, 2005. 8
Normalized Network Modularity = density of intra-cluster edges High Low # intra-edges # total edges normalize by cluster size Z : set of whole nodes Zk : set of nodes in cluster k L(A,B) : #edges between A and B Guimera, et al., Nature, 2005., Newman, et al., Phy. Rev. E, 2004. 9
Cost Combining Numerical Vectors with a Network network Cost of numerical vector Normalized modularity (Negative) cosine dissimilarity Mω 10
Our Proposed Spectral Clustering for ω = 0…1 Compute matrix Mω= To optimize cost J(Z) = tr{ZTMωZ} subjet to ZTZ=I,compute eigen-values and -vectors of matrix Mωbyrelaxing elements of Z to a real valueEach node is represented by K-1eigen-vectors Assign a cluster label to each node by k-means.(k-means outputs in spectral space.) e2 e2 e1 is sum of dissimilarity (cluster center <-> data) end ・Optimizeweight ω x x Eigen-vector e1 11
Table of Contents • MotivationClustering for heterogeneous data(numerical + network) • Proposed method Spectral clustering (numerical vectors + a network) • ExperimentsSynthetic data and real data • Summary 12
Synthetic Data Numerical vectors (von Mises-Fisher distribution) θ = 1 50 5 x3 x3 x3 x2 x2 x2 x1 x1 x1 Network (Random graph) #nodes = 400, #edges = 1600 Modularity = 0.375 0.450 0.525 13
Results for Synthetic Data Modularity = 0.375 Numerical vectors 5 50 θ = 1 θ = 1 x3 x3 x3 Costspectral θ = 5 θ = 50 x2 x2 x2 x1 x1 x1 Network NMI #nodes = 400, #edges = 1600 Modularity = 0.375 ω Network only (maximum modularity) Numerical vectors only (k-means) ・Best NMI (Normalized Mutual Information) is in 0 < ω < 1・Can be optimized using Costspectral 14
Results for Synthetic Data Modularity = 0.375 0.450 0.525 θ = 1 Costspectral θ = 5 θ = 50 NMI ω ω ω Network only (maximum modularity) Numerical vectors only (k-means) ・Best NMI (Normalized Mutual Information) is in 0 < ω < 1・Can be optimized using Costspectral 15
Synthetic Data (Numerical Vector) + Real Data (Gene Network) True cluster (#clusters = 10) Resultant cluster (ω=0.5, θ=10) θ = 10 Costspectral θ = 102 θ = 103 Gene network by KEGG metabolic pathway NMI ・Best NMI is in 0 < ω < 1 ・Can be optimized using Costspectral ω 16
Summary • New spectral clustering method proposedcombining numerical vectors with a network・Global network property(normalized network modularity)・Clustering can be optimized by the weight • Performance confirmed experimentally・Better than numerical vectors only and a network only・Optimizing the weight with synthetic dataset and semi-real dataset 17
Thank you for your attention! our poster #16
Spectral Representation of Mω (concentration θ = 5 , Modularity = 0.375) ω = 0.3 ω = 0 ω = 1 e3 e3 e3 e2 e2 e2 e1 e1 e1 Cost Jω = 0.0932 0.0538 0.0809 Select ω by minimizing Costspectral (clusters are divided most separately)
Result for Real Genomic Data • Numerical vectors : Hughes’ expression data (Hughes, et al., cell, 2000) • Gene network : Constructed using KEGG metabolic pathways(M. Kanehisa, etc. NAR, 2006) Our method Normalized cut Ratio cut NMI Costspectral Our method ω ω
Evaluation Measure Normalized Mutual Information (NMI) between estimated cluster and the standard cluster H(C) : Entropy of probability variable C, C : Estimated clusters, G : Standard clusters The more similar clusters CandG are, the larger the NMI. 14
Web Page Clustering Numerical Vector Frequency of word Z … Frequency of word A To improve accuracy, combine heterogynous data 1 2 3 Network 4 5 6 7
Spectral Clustering for Graph Partitioning Ratio cut Subject to Normalized cut Subject to L. Hagen, etc., IEEE TCAD, 1992., J. Shi and J. Malik, IEEE PAMI, 2000.