Download
1 / 12
140 likes | 371 Views
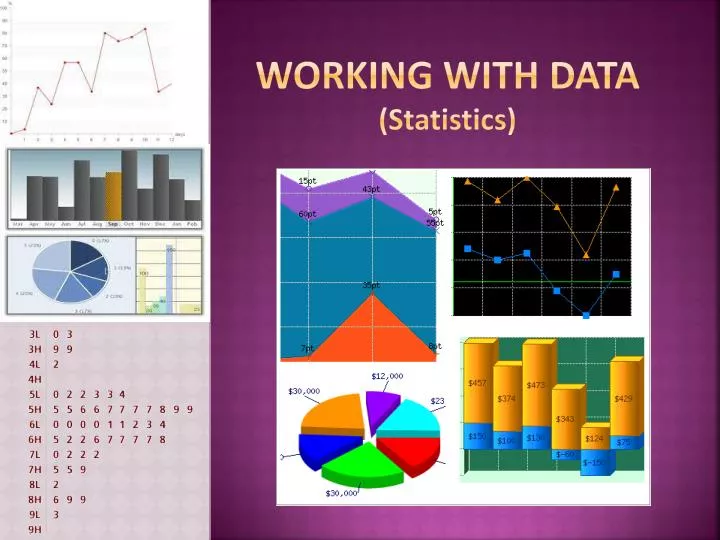
WORKING WITH DATA ( Statistics ). Statistics. Statistics is the collection, organization and processing of data. Organization and analyzing data helps make large quantities of information easier to understand.

E N D
Statistics • Statistics is the collection, organization and processing of data. • Organization and analyzing data helps make large quantities of information easier to understand. • Graphs and other visual charts present information in a way that is instantly understandable.
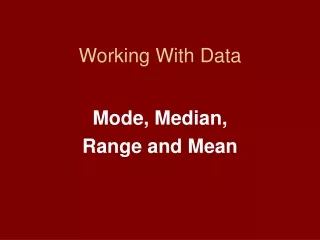
Working with Data • Data collected from a questionnaire may be organized into tables to make it easier to understand. • Once in the table, the data can also be presented in graph form. • Graphs make it easier to interpret data. They show trends clearly which makes the data easier to analyze.
Table 4: Television viewing, by age and gender, by province Source:Statistics Canada CANSIM, tables (for fee) 502-0002 and 502-0003 and Catalogue no. 87F0006XIE.Last modified: 2006-12-22.
Stem and Leaf Plots • A stem-and-leaf plot is a way of organizing and displaying numerical data. It looks like a t-chart. • Numbers are grouped together by “place value”. The stem represents the first digit (written only once)and is located in the left column and the leaf/leaves represent the second digit which can be written many times in rows and are found in the right column. • The data values in the stem are in order vertically from least to greatest. • The data values in the leaves are in order horizontally from least to greatest.
Bar graphs is used to make comparisons in a collection of data. • The length or height of bars represent the frequency or quantities in different categories. • Spaces between the bars indicate that the categories are separate from one another. • Types of Bar Graphs • Horizontal or vertical • 3-dimensional • Double bar • Stacked bars
histograms • A histogram is like a bar graph that has been adapted to show data in continuous numerical intervals usually measurements. • The categories on the horizontal axis (x-axis) are continuous number intervals (there are no gaps between the numbers). • The bars in a histogram touch to show the continuity. • The heights of the bars show the frequency of the data.
A Comparison of Bar Graphs and Histograms Similarities: • All the bars in a bar graph or histogram are the same width. • Data categories are shown the x-axis (horizontal). • Categories do not have to be numerical. • Categories can appear in any order. • Spaces between bars indicate that the categories are separate from each other. • Not all bar graphs show frequency. For example, average monthly rainfall in Brampton. • Categories must be numeric intervals. • Categories must be in ascending order. • The right boundary of an interval is the left boundary of the next interval (there is no space between the bars). • All histograms show frequency. Bar Graphs Histograms
Line Graphs • Line graphs are used to show trends in data, usually over time. They also are used to determine relationships between two variables. • Data from a table is plotted on the graph as points and these points are joined to create a line. • Line graphs are sometimes called broken-line graphs since they appear jagged or crooked rather than a straight line. Types of Line Graphs Single line graph Double line graph
Scatter Plots • A scatter plot is a graph in which plotted points are used to show the correlation or relationship between two variables. • The plotted points are not connected. If there is no relationship between the variables, the points will be scattered randomly. If there is a relationship between the variables, the scattering of the points will show a pattern.
Comparing Line graphs and Scatter Plots • Line graphs can be used to determine the relationship between two variables and to look for trends in data, often over time. • Solid or dashed lines are used to join the points on a line graph. • Scatter plots can be used to determine the relationship between two variables and to look for trends in data • The plotted points are not connected • Plotted points will form a pattern if there is a trend or relationship between the variables. Line Graphs Scatter Plots
Circle Graphs • Circle graphs show how a whole set of data can be subdivided into categories. • The categories of a circle graph cannot overlap and when combined must add to the total or whole (e.g. 100%). • The size of each segment indicates the relative sizes of different segments and makes comparison of data quick and easy.