Download
1 / 15
150 likes | 312 Views
Data Quality SHARPn. Nov 18, 2013. Recent summary of goals. Objectives 1. Enumeration of data sources for each of 4 types of data: a) Diagnoses b) Laboratory values c) Vital signs ( Ht , Wt , BMI, SBP, DBP, HR) d) Medications

E N D
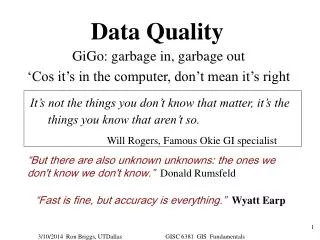
Data QualitySHARPn Nov 18, 2013
Recent summary of goals • Objectives • 1. Enumeration of data sources for each of 4 types of data: • a) Diagnoses • b) Laboratory values • c) Vital signs (Ht, Wt, BMI, SBP, DBP, HR) • d) Medications • 2. Characterize sources, availability, quality, other characteristics • 3. Draw samples from each source • 4. Compare sources and data • a) Within institution • b) Across institution
List of projects • “John Henry” study. Compare machine and person in screening patients • Intra-institution heterogeneity • Parallel analyses of data variation within site • Inter-institution heterogeneity • Data mining to enhance space of relevant terms • BMI in the EHR at 2 sites
2) Intra-institution heterogeneity • Compare different sources of “Same data” • Diagnoses • Labs • Meds
Intra-institution comparison of data sourcesMayo Billing data vs. Problem List
Intra-institution comparison of data sourcesIMtn regional differences in data
Intra-institution comparison of data sourcesIMtn Type of Encounter differences
Intra-institution comparison of data sourcesIMtn data recorded IP v Ambon same random adult cohort (n = 3191)with IP and Amb encounters 2007-2011
Mayo/Intermountain comparisons • Example of template for inter-institutional data source comparison
4) Machine Learning • Use of Frequent Item Sets & Associative Classification methods • Discover most ‘interesting’ (mathematically) differences in two large data sets • Applied to measure differences in sources of data • Will apply to compare Mayo, Imtn data sets • Susan Rea, InterMountain