Download
1 / 19
280 likes | 639 Views
Uncertainty and Significant Figures. Cartoon courtesy of Lab-initio.com. Uncertainty in Measurement. A digit that must be estimated is called uncertain . A measurement always has some degree of uncertainty. Why Is there Uncertainty in Numbers?.

E N D
Uncertainty and Significant Figures Cartoon courtesy of Lab-initio.com
Uncertainty in Measurement • A digit that must be estimatedis called uncertain. Ameasurementalways has some degree of uncertainty.
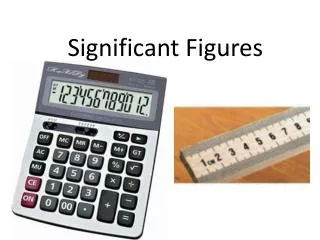
Why Is there Uncertainty in Numbers? • Measurements are performed with instruments and tools • No instrument or tool can read to an infinite number of decimal places Which of these balances would have the greatest uncertainty in measurement?
Precision and Accuracy • Accuracy:how close your value is to the true value. • Precision: how close several measurements are to each other if made in the same manner. • Tape demo • Label the following as accurate, precise, neither or both. Precise ONLY not accurate BOTH Precise AND accurate Neither
Major Types of Error • Random Error(Indeterminate Error unknown problem) - measurement has an equal probability of being over or under true value. • Systematic Error(Determinate Error: known problem) - Occurs in the same direction each time (high or low), often resulting from poor technique or incorrect calibration.
Experimental Error • There is ALWAYS error in experiments. • Acceptable reasons for error on labs • Limitations in the measuring devices • Contaminated chemicals • Temperature and pressure conditions • Air resistance • Anything you cannot control is ok. • But Never EVER Human Error. If there is human error, you must redo the experiment without the human error.
Applying to a Scientific Problem • The following data was obtained by students in a laboratory experiment regarding density. The small metal object that was weighed had an actual mass of 25.11 grams. • What do you think about the accuracy and precision of each data set given this information? Neither Neither Both Precision
To know just how accurate measurements were made (How close to the accepted value or target value) a Percent Error is calculated. For example, if asked “How accurate was your answer?” The best way to answer is something like “I had a percent error of 5.4%.” Percentage of Error Formula: COPY IT! *The lines mean ‘absolute value’ so no + or – usually
Ex. The boiling point of ethanol was found three times and averaged to be 76.35°C. If the accepted boiling point of ethanol is 78.1°C, then what is the percent error? Let’s try it together! Formula Substitute Solve! 2.2% + Therefore how accurate was the measurement? 97.8%
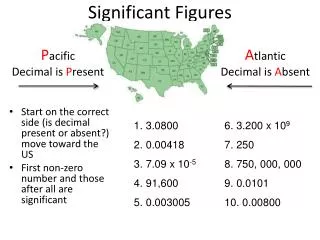
Rules for Counting Significant Figures - Details • Nonzero integersalways count as significant figures. • 3456has • 4significant figures
Rules for Counting Significant Figures - Details • Zeros • -Leading zerosdo not count as significant figures. • 0.0486has • 3significant figures
Rules for Counting Significant Figures - Details • Zeros • -Captive zeroes ‘trapped’ between numbers always count as significant figures. • 16.07has • 4significant figures
Rules for Counting Significant Figures - Details • Zeros • Trailing zeros are significant only if the number contains a decimal point. • 9.300has • 4significant figures
Rules for Counting Significant Figures - Details • Exact numberstechnically have an infinite number of significant figures. • 1inch=2.54cm, exactly
Sig Fig Practice #1 How many significant figures in each of the following? Write down the question and your answer NO CALLING OUT! 1.0070 m 5 sig figs 17.10 kg 4 sig figs 100,890 L 5 sig figs 3.29 x 10³ s 3 sig figs 0.0054 cm 2 sig figs 3,200,000 2 sig figs
Rules for Significant Figures in Mathematical Operations • Multiplication and Division: # sig figs in the result equals the number with the least precise measurement used in the calculation. • It’s like trying to make an omelet with 2 eggs and 6 lbs of cheese... • The smaller number prevents more precison! • 6.38 x 2.0 = • 12.76 13 (2 sig figs)
Calculator Sig Fig Practice #2 Correct Answer Calculation Calculator says: 22.68 m2 3.24 m x 7.0 m 23 m2 100.0 g ÷ 23.7 cm3 4.22 g/cm3 4.219409283 g/cm3 0.02 cm x 2.371 cm 0.05 cm2 0.04742 cm2 710 m ÷ 3.0 s 236.6666667 m/s 240 m/s 5870 lb·ft 1818.2 lb x 3.23 ft 5872.786 lb·ft 2.9561 g/mL 2.96 g/mL 1.030 g ÷ 2.87 mL
Rules for Significant Figures in Mathematical Operations • Addition and Subtraction: The number of decimal places in the result equals the number of decimal places in the least precise measurement. • 6.8 + 11.934 = • 18.73418.7(3 sig figs)
Calculator Sig Fig Practice #3 Correct Answer Calculation Calculator says: 10.24 m 3.24 m + 7.0 m 10.2 m 100.0 g - 23.73 g 76.3 g 76.27 g 0.02 cm + 2.371 cm 2.39 cm 2.391 cm 713.1 L - 3.872 L 709.228 L 709.2 L 1821.6 lb 1818.2 lb + 3.37 lb 1821.57 lb 0.160 mL 0.16 mL 2.030 mL - 1.870 mL