Download
1 / 33
330 likes | 443 Views
DataScope: A Database Content Visualization Tool based on Ranking Queries. CS511 Course Project Tianyi Wu Dec 08, 2006. DataScope. Motivation Contributions Demonstration Architecture Design & Implementation Future Work. DataScope. Motivation Contributions Demonstration Architecture

E N D
DataScope: A Database Content Visualization Tool based on Ranking Queries CS511 Course Project Tianyi Wu Dec 08, 2006
DataScope • Motivation • Contributions • Demonstration • Architecture • Design & Implementation • Future Work
DataScope • Motivation • Contributions • Demonstration • Architecture • Design & Implementation • Future Work
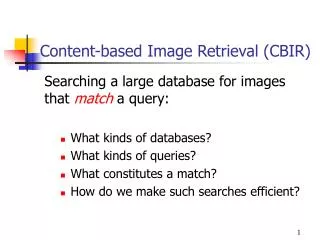
Motivation • Existing database systems • SQL query-based • Form-based • Limited user interface • Inconvenient to browse data • Existing database visualization • Polaris – Stanford • Stotle et al. Query, analysis, and visualization of hierarchically structured data using Polaris. KDD 2002. • DIVE-ON – U of Alberta • Ammoura et al. Towards a novel OLAP interface for distributed data warehouses. DaWaK 2001. • Maryland • Various projects and tools • http://www.cs.umd.edu/hcil/research/visualization.shtml
Limitations of Existing Work • Particular domains • Spatial-temporal • Time-series • Predefined schemas • Fixed visual representation • Statistical charts. (e.g. scatterplots)
DataScope • Motivation • Contributions • Demonstration • Architecture • Design & Implementation • Future Work
Goal • Visualize databases like Google Maps! • Content-based • Explorative, easy-to-use • Dragging (pan), drilling (zoom)… • Domain independent • Web-based interfac • Fast query processing
Challenges • Layout • Not well-defined and well-understood • Maps : longitude, latitude • How to position objects on screen? • User preferences on what to see • Different users have different preferences • Even the same user may have different preferences based on the context of the query • Data is often associated with multiple hierarchies or semantic links • Powerful query engine
Contribution • Interface design • Principles which can address the above challenges • A system prototype • Efficient implementation • Ranking-Cube [Xin et al. VLDB’06] • Ranking Aggregation
DataScope • Motivation • Contributions • Demonstration • Architecture • Design & Implementation • Future Work
About the Demo • Not fully-functional yet • Ajax vs. PHP • Demonstrate important concepts • Ranking • Efficiency • Customization • Datasets • Real: DBLP (extracted 20387 database related entries) • Synthetic: store database
DataScope • Motivation • Contributions • Demonstration • Architecture • Design & Implementation • Future Work
DataScope • Motivation • Contributions • Demonstration • Architecture • Design & Implementation • Future Work
DataScope Overview • Design principles • Structured dimensions • Ordering of attribute values • Selection of comprehensive layout • Quick selection • Display rich information • Easy customization • Implementation • Linear ranking functions with arbitrary selections • Ranking on aggregation
Design principles • Structured dimensions • View data in multi-resolution • Roll-up and drill-down • Can be automatically generated • Numeric attributes • Age, salary, price • Categorical attributes • Milk - dairy products - food
Design principles • Ordering of attribute values • How to order values along X/Y axis? • Ascending/Descending • Alphabetic order (e.g. AAAI, CIKM…) • Numeric order (e.g. 2001, 2002…) • Independent of any ranking function • The order of a value is not determined by its score
Design principles • Selection of comprehensive layout • Initial layout • High-level, familiar to most users • Map - US map • DBLP – (AI, Theory, System)*(80s, 90s, 00s) • Subsequent layout • Can be changed according to different data • Customizable
Design principles • Quick selection • Dragging • Scrolling the mouse wheel to roll-up/drill-down or zoom in/out • Push constraint easily • Context menu
Design principles • Display rich information • Top-k (as in Google Maps) • K-representative items • Outliers • Display primitives • Color, size (e.g. big cities have big font), etc. • Searching
Design principles • Easy customization • Users can freely define their own layout • X=location, Y=year • Adjust the resolution • More/less objects on screen • Customize ranking function • e.g. rank houses by “0.7*Price+0.3*size” • Selection “database conferences” and “2003-2006”
Implementation • Ranking-Cube • Xin Et al. Answering top-k queries with multi-dimensional selections (VLDB’06) • Linear ranking functions • Arbitrary selections • Methods • Partition the data space and store blocks • Progressively retrieve the most promising blocks for each query • Data fragments • Partial materialization to deal with high dimensionality
Ranking on Aggregation • Example • Given a relation (conference, year, author, paper) • Query • SELECT top k COUNT(author) • FROM R • GROUP BY conference, year
Ranking on Aggregation • Method • Materialization for all possible cuboids • Algorithm • Input: aggregation dimension D, ranking dimensions R, concept hierarchies H. • Output: a set of ranking fragments S; • 1) For each possible group-by of R and H • 2) Compute aggregation for each value in D ; • 3) Compute ranking fragments for D; • 4) S = S + D;
DataScope • Motivation • Contributions • Demonstration • Architecture • Design & Implementation • Future Work
Conclusion • DataScope • Extend the current prototype to support mapping operations and multiple sessions • Improve design principles which can lead to a more effective interface • Support various ranking queries efficiently
Future work • Interface • Improve the initial system prototype • Support the full set of operations • Support easy customization • Implementation • Rich research issues • Ranking objects based on user feedbacks • Retrieve most relevant objects in keyword searching • Multiple types of ranking queries
Thank you! Any questions?