Download
1 / 48
480 likes | 619 Views
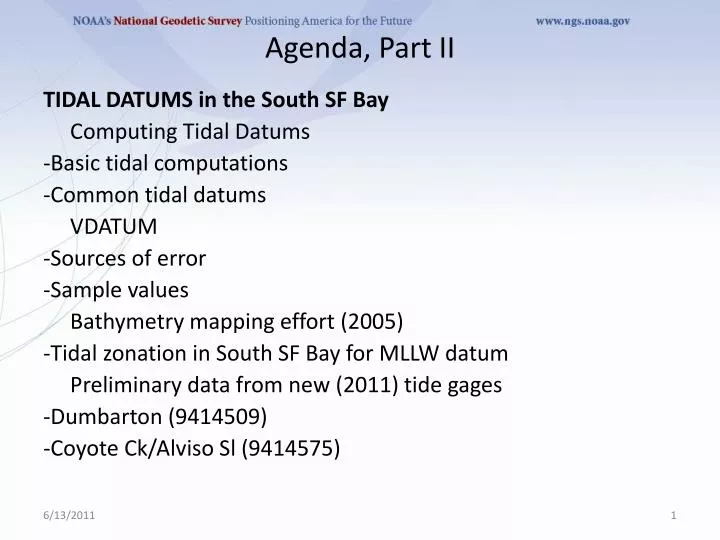
Agenda, Part II. TIDAL DATUMS in the South SF Bay Computing Tidal Datums -Basic tidal computations -Common tidal datums VDATUM -Sources of error -Sample values Bathymetry mapping effort (2005) -Tidal zonation in South SF Bay for MLLW datum

E N D
Agenda, Part II TIDAL DATUMS in the South SF Bay Computing Tidal Datums -Basic tidal computations -Common tidal datums VDATUM -Sources of error -Sample values Bathymetry mapping effort (2005) -Tidal zonation in South SF Bay for MLLW datum Preliminary data from new (2011) tide gages -Dumbarton (9414509) -Coyote Ck/AlvisoSl (9414575)
NWLON Stations Essential Equipment Control Stations • Automatic water level sensor • Backup water level sensor • Backup & Primary data collection platform • Protective well • Shelter • Solar Panel • GOES satellite radios • Telephone modem • Ancillary geophysical instruments • System of Bench Marks • Water Level • Wind Speed/Direction • Barometric Pressure • Air/Water Temp. • Conductivity/Temp • Chart Datum • Tsunami/Storm Surge Short term stations • Data Collection Platform • Acoustic or pressure sensor • Solar Panel • GOES Transmitter Observations Collected
Tide Type Varies by Region due to Local Hydrodynamics Types of Tides
Semidiurnal two daily highs & lows ~ similar height Types of Tides Most common Mixed two daily highs & lows ~ not similar height Diurnal one daily high & low
Tide Generating Forces • Astronomical Forces: • Gravitational pull of Moon creates bulge directly beneath Moon • Centrifugal forces due to the Earth-Moon’s rotation creates second bulge opposite of Moon • Variations in the positions of the Moon & Sun relative to the Earth produce monthly variations in tides • Variations in the path of the Moon about the Sun produce decadal (18.6 yr) variations in tides • Variations in the distance of the Earth/Moon from the Sun/Earth due to their elliptical orbits produce annual/monthly variations in tides • Variations in the declination of the Moon produces daily variations in the tides • Tides: • Deterministic; predictable • With enough water level data, the tides can be predicted indefinitely for that location until/when there are changes to the geometry—bathymetrically or along the coastline
Moon Phase Inequality Affects the amplitude of the tides (tidal range) Moon Phases: Spring Neap Spring Neap
Data Processing Continuous Operational Real-Time Monitoring System (CORMS) • Real-Time 24x7 QA/QC • Human Analysis • Data Quality Flags (e.g. Rate of Change) • Corrective Action • Post-Processing • Error in Data (e.g. spikes, missing data) • Data Quality Flags: shifts, bias, changes • Tabulation & Product Generation • Backup Gain and Offset • Verification & Acceptance
Data Processing Criteria for determining a Tide Programmed into the computer algorithms. Two-hour rule:Adjacent high and low waters must be different by 2 hours or more in time in order to be counted as a tide. One-tenth of a foot rule (same as 0.03 m rule): Adjacent high and low waters must be different in elevation by one tenth of a foot (or 0.03 m) or more in order to be counted as a tide for tabulation. Difference in elevation Difference in time
Tidal Datums Station Datum: Unique to each water level station - Established at a lower elevation than the water is ever expected to reach. - Referenced to the primary bench mark at the station - Held constant regardless of changes to the water level gauge or tide staff MHHW: Mean Higher High Water The average height of the higher high water of each tidal day observed over the NTDE MHW: Mean High Water The average of all the high water heights observed over the NTDE MTL: Mean Tide Level The arithmetic mean of mean high water and mean low water MSL: Mean Sea Level or LMSL: Local Mean Sea Level The arithmetic mean of HOURLY heights observed over the NTDE MLW: Mean Low Water The average of all the low water heights observed over the NTDE MLLW: Mean Lower Low Water The average of the lower low water height of each tidal day observed over the NTDE GT: Great Diurnal Range The difference in height between mean higher high water and mean lower low water
National Tidal Datum Epoch (NTDE) A common time period to which tidal datums are referenced • A specific 19 year period that includes the longest periodic tidal variations caused by the astronomic tide-producing forces. • Averages out long term seasonal meteorological, hydrologic, and oceanographic fluctuations. • Provides a nationally consistent tidal datum network (bench marks) by accounting for seasonal and apparent environmental trends in sea level that affect the accuracy of tidal datums. • The NWLON provides the data required to maintain the epoch and make primary and secondary determinations of tidal datums.
Station datum • Unlike water level (tidal) datums that will change each epoch because the world is dynamic, a station datum is FIXED forever and ever (hopefully). • It is used to calculate and relate the difference in datum heights between tidal epochs. • MLLW datum, by convention, is always the reference tidal datum, eg, 0.0, for each tidal epoch. To know how much change there was between tidal epochs, one references the values to the station datum.
Station datum: misunderstood, risk of misuse Blank ≠ 0 !
Don’t know this one’s Designation, only its PID, so retrieved DS by PID GU4117 DESIGNATION - 941 3450 N TIDAL Feet AND meters Primary Bench Mark for the tide gage
NWLON Stations Vertical Datum Reference Vertical Datum Reference characteristics are: Water levels accurately known relative to the latest tidal datums on the latest National Tidal Datum Epoch (NTDE) Water levels accurately known relative to the land and a local network of recoverable tidal bench marks Precise connections to the national geodetic vertical datum (NAVD88) using level connections or GPS connections to the bench marks in the National Spatial Reference System (NSRS) NGS Accuracy Standards 2nd Order, Class I for long-term stations 3rd Order for short-term stations Annual leveling for NWLON installation and removal levels for short-term stations Emergency leveling for storm events GPS Receivers collecting simultaneous data at bench marks . GPS Receiver Tide Gauge Tidal Bench mark 4811 G 2004 3.150 m Pier NOAA 1.150 m (example) 2.736 m MHW Tidal Bench mark 4811 G 2004 Geodetic Benchmark (and its WGS84 value) Relative to Tidal Datum 2.000 m Bench mark with geodetic control (NAVD88) 1.220 m MLLW NAVD88 Orifice 0.7428 m Station Datum
Non-primary (secondary and tertiary) stations are plotted if you change datatype to ‘Tide Predictions’
The time period was 12 months, fr Apr 84-Mar 85, epoch 1983-2001
VDATUM • Modeling program that enables conversions between multiple vertical datums—ellipsoidal, geodetic, tidal- at your specified location • Be fully aware of the errors, eg, Standard Deviation, from transformations among datums, and from source data; types of error include: variations in the tidal range, tidal phase differences, bathymetric and coastal features, the density and proximity of nearby stations used in the corrections
Errors from source data and transformations, using Chesapeake Bay dataset as an example
South SF Bay Info, fr 2005 • USGS Bathymetric survey • Needed Zonation scheme for area to indicate delay in time and range corrector relative to the primary gage(s) (all Harmonic predictions) • 4688: San Leandro Marina • 4458: San Mateo Bridge • 4523: Redwood City • 4509: Dumbarton
2011 Tide gage Installation • Dumbarton, 9414509, 3 months (Tertiary) • Coyote Ck/AlvisoSl, 9414575, 1 year (Secondary)