Download
1 / 19
190 likes | 347 Views
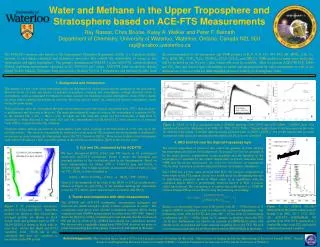
On-orbit Calibration and Initial Validation Comparisons for the ACE-FTS. Kaley A. Walker, Chris Boone, Randall Skelton, Sean McLeod, and Peter F. Bernath Department of Chemistry, University of Waterloo ASSFTS Meeting – May 20, 2005. Size: 1.12 m dia. x 1 m Total mass: 152 kg

E N D
On-orbit Calibration and Initial Validation Comparisons for the ACE-FTS Kaley A. Walker, Chris Boone, Randall Skelton, Sean McLeod, and Peter F. Bernath Department of Chemistry, University of Waterloo ASSFTS Meeting – May 20, 2005
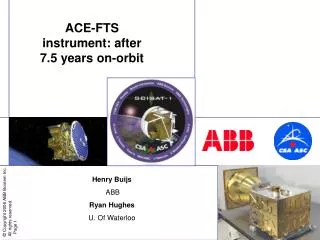
Size: 1.12 m dia. x 1 m Total mass: 152 kg Total power: 70 W (from single solar panel) Launch date: August 12, 2003 Launch vehicle: Pegasus XL (provided by NASA) Orbit: 74° inclined circular orbit at 650 km SCISAT-1
ACE Instruments ACE-FTS: • a high resolution (0.02 cm-1) infrared Fourier transform spectrometer operating between 2-13 microns • 2-channel visible/near infrared imager operating at0.525 and 1.02 microns MAESTRO: • dual UV / Visible / NIR diode array spectrophotometer measuring from 0.270 to 1.040 microns, resolution ~1-2 nm Instrument Pointing: suntracker located within ACE-FTS
Baseline ACE Measurements • ACE-FTS: O3, CH4, H2O, NO, NO2, ClONO2, HNO3, N2O, N2O5, HCl, CCl3F (CFC-11), CCl2F2 (CFC-12), HF, CO, temperature and pressure (from CO2) ACE-FTS Imagers: atmospheric extinction • vertical resolution ~ 3-4 km (for both FTS and imagers) • MAESTRO: O3, NO2, atmospheric extinction, (temperature and pressure from O2 A-, B- and -bands) • vertical resolution ~1-2 km Altitude range for retrieved results ~10-50 km (max. 100 km)
On-orbit Commissioning Important phase in early lifetime of a satellite mission • Instrument functional testing and bus commissioning activities – conducted by industrial partners • For ACE mission, “Science” commissioning phase was also undertaken for both instruments by Science Team • Preparation for routine operations • Extend pre-launch calibration and performance verification measurements • Process completed in January 2004
Science Commissioning Activities • Preliminary measurements • Simultaneous commanding, confirming parameter settings for all instruments • Instrument pointing and suntracker offsets • Verify location of instrument FOVs and optimize solar pointing • Refine occultation command sequences • Secondary Science Modes (near-nadir for FTS)
Closed-loop Offsets • From acceptance testing at ABB, it was known that FTS FOV was offset from Sun centre by ~2.9 mrad • So fixed suntracker closed-loop offsets must be used to adjust ACE-FTS FOV to Sun centre FTS FOV position shown here was determined from Science Calibration Testing in Winter 2003
FTS FOV (1.25 mrad) Offset position Suntracker Stepsize Test Investigated closed-loop pointing offsets in both axes to understand dependences and determine stepsize Determined offsets graphically from both VIS and NIR data Average stepsize = 0.0023 mrad Kathy Gilbert
“down” scan “up” scan Co-registration Determination Sunscan in elevation - comparing FTS (MCT DC level) and MAESTRO (UV channel integrated intensity) • Effects of solar limb darkening can be seen Florian Nichitiu
Validation Program • Will be starting soon – once data set is available! • Initially limited by availability of processed data • ACE-FTS routine processing version 1.0 was completed for sunsets Jan.-Oct. 2004 – version 2.2 has been started • Imager and MAESTRO data release for Science (and Validation) Team is expected in next month • “Pre-comparisons” have been done with selected data sets • Inter-comparisons between ACE-FTS and MAESTRO • Satellite instruments – POAM III, SAGE III, HALOE, MLS, OSIRIS, GOMOS … • ACE Arctic Validation Campaign at Eureka (Feb. – Apr.)
ACE-FTS MAESTRO comparison O3 and NO2 profiles from 23 February 2004 over Canadian Arctic: 78°N, 134°W MAESTRO retrievals use ACE-FTS T/p and shift applied to account for offset between FOVs and empirically account for timing uncertainty Tom McElroy
ACE-FTS - POAM III: O3 ACE-FTS up to 25% higher than POAM from 40-60 km Lower than POAM III by up to ~10% from 15 and 40 km. Maybe due to difference in vertical resolution? average latitude: 67°N Profiles within 500 km and 2 hours; using POAM III version 4.0 data Thanks to Cora Randall
ACE-FTS - SAGE III comparison ACE-FTS up to 38% higher than SAGE III from 40-55 km No indication of significant altitude registration errors but between 15-40 km, ACE-FTS lower than SAGE III by ~10% average latitude: 76°N Profiles within 500 km and 2 hours; using SAGE III version 3.0 data Thanks to Chip Trepte
ACE-FTS HCl is 10-20 % higher than HALOE in all comparisons Similar results seen for HF HCl Comparisons MLS-ACE-HALOE ACE-FTS is 3-5% higher than MLS ACE version 1.0, HALOE V19, MLS v1.4.8 Lucien Froidevaux and the MLS team
ACE-FTS - Radiosonde Comparison Maximum difference 15-25 km: 1.1 K Overall: 2.1 K For 8 profiles – within 200 km Max. diff. ~ 2-3 K Other comparisons with CHAMP, SABER and lidar in progress T retrieved above this point
Below 0.2hPa (60 km), ACE-FTS and MLS agree to within 1-3 K Coincidence criteria within 1° lat. and 12 ° lon., same day ~600 matched pairs ACE version 2.1, MLS v1.5 ACE-FTS – MLS: Temperature ACE-FTS MLS MLS-ACE Lucien Froidevaux
Summary • ACE satellite is operational and has been performing well taking occultation measurements since February 2004 • ACE-FTS and MAESTRO routine processing operational • Science Commissioning phase completed in January 2004 • Verified performance and completed calibration measurements on-orbit • “Pre-comparisons” have been done between ACE instruments and with satellite, sonde and Eureka campaign data • Results are looking very promising
Acknowledgements Funding for ACE is provided by: • Canadian Space Agency • Natural Sciences and Engineering Research Council of Canada (NSERC) • NSERC-Bomem-CSA-MSC Industrial Research Chair in Fourier Transform Spectroscopy (at U. of Waterloo)