Download
1 / 29
290 likes | 319 Views
Explore the basic macroeconomic relationships between consumption, disposable income, savings, and national GDPs from 1983 to 2005. Learn about key concepts like average propensity to consume, marginal propensity to save, and non-income determinants affecting consumption and savings patterns.

E N D
ECON 201 Chapter 8 Basic Macroeconomic Relationships
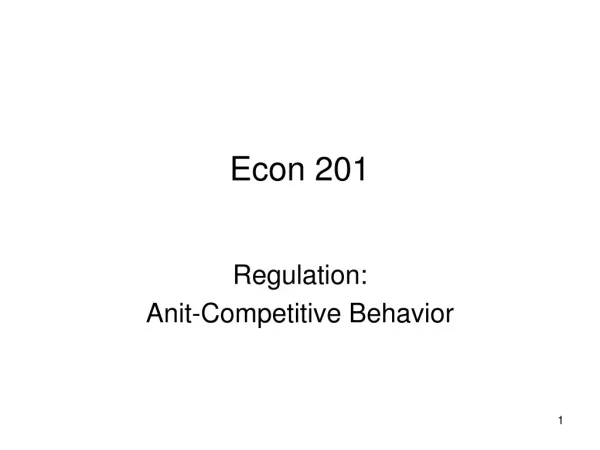
05 04 03 02 01 00 99 98 97 96 95 94 93 92 91 90 89 88 87 86 85 84 83 Consumption and Disposable Income, 1983-2005 45° Reference Line C=DI C Saving In 1992 Consumption (billions of dollars) Consumption In 1992 45° Disposable Income (billions of dollars)
Income & Consumption As a general rule, households increase their spending as their disposable income goes up Figuring out how much people ‘save’ (S) is easy… take Disposable Income (DI) and subtract Consumption (C): S = DI – C
Income & Consumption…cont. If a household consumes more than it makes, we have ‘dissaving’, which is bad! How can this happen??.... You sell stuff for cash, or borrow. A ‘break-even’ income is where you spend exactly what you make. Which also means you don’t save anything.
Average Propensity to Consume APC – the percentage of total income that is consumed consumption APC = --------------------- income
Average Propensity to Save APS – the percentage of total income that is saved saving APS = --------------------- income
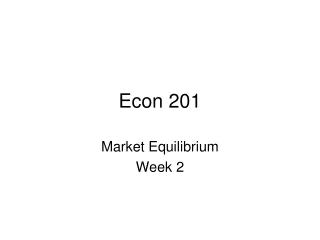
Average Propensities to ConsumeSelect Nations GDPs .80 .85 .90 .95 1.00 United States Canada United Kingdom Japan Germany Netherlands Italy France .963 .958 .953 .942 .896 .893 .840 .833
Marginal Propensity to Consume MPC – the percentage of any change in income that is consumed Change in consumption MPC = --------------------------------- Change in income
Marginal Propensity to Save MPS – the percentage of any change in income that is saved Change in saving MPS = -------------------------- Change in income
Example calculation • Always remember: APC + APS = 1 MPC + MPS = 1 • Example: • My income increases from $1,200 to $1,700 • My saving increases from $100 to $300 • My MPS = 200 / 500 = 2/5 ths • Therefore, my MPC = 3/5 ths
Non-income determinates of Consumption and Saving • How much you make is the basic deter. of how much you will consume and save. But there are other things that might deter. how much you consume or save…. • Wealth – when the value of your wealth goes up, you will tend to spend more and save less. This is called the ‘wealth effect’. Also, the opposite is true.
Wealth Effect really true? (pg 153) • Between 2000 and 2002, the stock market lost over 3.7 trillion dollars in value, so the general ‘wealth’ of the American citizens went down, yet consumption spending was still going up! • Why? • Personal income tax rates were cut, giving more money in people’s pockets. • Lower interest rates allowed people to refinance loans, reduce mo. payments, and free up money
Non-income determinates of Consumption and Saving…cont. Expectations – if you expect prices to go up tomorrow, you will be more likely to buy something today. However, if you expect hard times to happen, you might reduce your spending and save more. Real Interest Rates – when real interest rates fall, you will borrow more, consume more, and save less. When they rise, the opposite is true.
Non-income determinates of Consumption and Saving…cont. 4. Household Debt – when consumers as a group increase their household debt, they increase their consumption. And that makes sense….they use ‘credit’ to purchase things and fill up their garages with junk!!
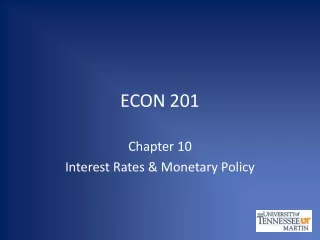
45° Consumption and Saving Schedules C1 C0 C2 Consumption (billions of dollars) Disposable Income (billions of dollars) S2 Saving (billions of dollars) S0 S1
Other important factors Taxes – an increase in taxes will cause people to spend less and save less, because their income will go down, and that effects both the APC and the APS. And inversely, if given a tax cut, people will increase their consumption and saving.
Interest Rates & Investment When businesses make an investment they expect to get something back if they invest. Figuring out what that ‘return’ is going to be is called the ‘expected rate of return’ Example: if you purchase a machine for $1,000 and you expect to get $1,100 in income from the use of that machine, you then get $100 in net profit. The expected rate of return is then 100/1,000 = 10%
Real Interest Rates If the interest you could earn from the money you spent on the investment is greater than what you can earn on the investment, then DON’T make the investment. In chapter 7 we learned that the real interest rate is the nominal rate adjusted for inflation So if you compare the investment rate of return and the real interest rate, you will know whether or not to make the investment.
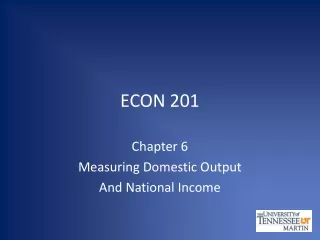
16 14 12 10 8 6 4 2 0 r and i (percent) 5 10 15 20 25 30 35 40 Investment (billions of dollars) Investment Demand Curve (pg 155) ID
Shifts of Investment Demand Curve (IDC) Some things happen that cause the IDC curve to shift left or right. Maint and Operating costs – the more it costs to maintain and operate a machine, the more the IDC shifts to the left, therefore reducing investment Business taxes - the higher the taxes, the more the IDC shifts to the left, therefore reducing investment
Shifts of Investment Demand Curve (IDC) Technological Change – a rapid rate of tech. progress moves the IDC to the right, so investment goes up Stock of Capital Goods On Hand – when the economy is selling all it makes, the rate of return on new investment goes up, so the IDC shifts to the right. Expectations – a positive outlook will shift the IDC to the right, and negative outlook will do the opposite
Shifts in the InvestmentDemand Curve Increase in Investment Demand r and i (percent) Decrease in Investment Demand ID1 ID0 ID2 0 Investment (billions of dollars)
Investment Instability • Investment rises and falls quite a bit. There are several reasons why: • Durability – certain things last a long time (buildings, machines) so they can be patched up and fixed to need be. • Irregularity of innovation – you never know when new technology will appear
Investment Instability…cont. • Variability of profits – when a firm makes more, it invests more. But profits are variable and uncertain • Variability of expectations – when a firm is optimistic about the future, that will affect their willingness to invest, and vice versa
Change in Real GDP Initial Change in Spending Multiplier Effect Multiplier = The multiplier effect is a change in a component of total spending which leads to a larger change in GDP
So what is it? Example: If I spend $100 at the store purchasing something, then that store will take that $100 and spend it, based on their MPC. So if they have an MPC of .75, then they will spend $75. So my initial spending of $100 caused a $175 increase in GDP
So what is it?...cont. So then that company spends the $75 with another company who has a MPC of .75 too. So then that company spends $56.25. This continues until you finally end up with a total of all the money that was spent because of your initial expenditure. Take that total and divide it by your initial exp. to get the multiplier: change in GDP/initial spending
Multiplier Example (2) Change in Consumption (MPC = .75) (1) Change in Income Increase in Investment of $5 Second Round Third Round Fourth Round Fifth Round All other rounds Total $ 5.00 3.75 2.81 2.11 1.58 4.75 $ 20.00 $ 3.75 2.81 2.11 1.58 1.19 3.56 $ 15.00 $ 1.25 .94 .70 .53 .39 1.19 $ 5.00 $20.00 $4.75 15.25 $1.58 13.67 $2.11 11.56 $2.81 8.75 ΔI= $5 billion $3.75 5.00 $5.00 1 2 3 4 5 All Rounds of Spending