Download
1 / 21
220 likes | 276 Views
Understand the application and benefits of Multilevel Modeling (MLM) in handling hierarchical data structures within institutional research. Learn how MLM can improve accuracy in estimating effects at higher levels and reduce errors due to clustering. Explore various MLM models and software for analysis.

E N D
Using Multilevel Modeling in Institutional Research Ling Ning & Mayte Frias Senior Research Associate Neil Huefner Associate Director Timo Rico Executive Director
Multilevel Data Structure • In institutional research, the data structure in the population is usually hierarchical, with students nested within instructors, majors, departments, colleges and campus divisions. • Sampling is conducted using multi-stage cluster sampling, rather than simple random sampling. • The above two factors give rise to multilevel data, in which lower level units are nested within higher level units
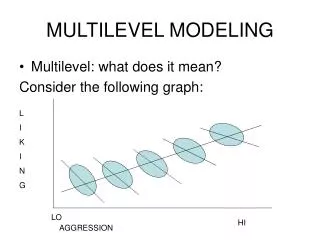
Overview • Motivations for using Multilevel Modeling (MLM) in Institutional Research • Consequences of not using MLM with clustered data • What is Multilevel Modeling (MLM)? • Random intercept, random slope and cross-level model • Computation software
How can the use of Multilevel Modeling (MLM) positively contribute to Institutional Research? • Allows one to calculate standard error more accurately • Offers insight into how effects vary at higher levels within the structure • Permits the inclusion of predictors at different levels within the model
Motivations for MLM|Standard Error Adjustment • Conventional methods assume independent observations • Knowing the information of one student tells nothing about another student’s information • Often not realistic in institutional research • Students in the same majors/student support programs same context more similar • Characteristics of one student information for the major information of another student in the same major
Motivations for MLM|Standard Error Adjustment Intraclass Correlation (ICC; ρ) • One way to quantify the degree of clustering (i.e., common effect associated with majors ) • = variance associated with majors • = student variance • Roughly speaking, correlation between students in the same major
Motivations for MLM|Standard Error Adjustment Consequences of Clustering • Clustering Overlapping information • Clustering Information SE • Ignore clustering Inflated Type I error (α) Spurious results Inflated information SE too small
Motivations for MLM|Standard Error Adjustment Example: Effect of a Tutoring Program on retention • 1000 students nested within 63 majors • 315 Participants , 685 Non-participants • Model: Participation Retention
Motivations for MLM|Standard Error Adjustment The Inflation of the alpha level of 0.05 in the presence of intra-class correlation (ICC) Source: Based on Barcikowski, R.S.(1981). Statistical power with group mean as the unit of analysis. Journal of Educational Statistics, 6, 267-285.
What is MLM|Unconditional Random Intercept Model (RIM) Level1: log(Pij/(1-Pij))= β0j (j = 1, 2, … , 63) Level 2: 0j=γ00 +U0j
What is MLM|Two-level Random Intercept Model (RIM) Level1: log(Pij/(1-Pij))= β0j + β1Tutoringij +β2HS GPAij (j = 1, 2, … , 63) Level 2: 0j=γ00 + γ01 STEM0j+U0j
What is MLM|Random Intercept Model Level1: log(Pij/(1-Pij))= β0j + β1Tutoringij +β2HS GPAij (j = 1, 2, … , 63) Level 2: 0j=γ00 + γ01 STEM0j+U0j logit (Retention) Major 1 … Major 5 Average Tutoring Effect … Major 63 0j : γ00 : 0 Tutoring
What is MLM|Random Slope Model Level1: log(Pij/(1-Pij))= β0j + β1jTutoringij +β2HS GPAij (j = 1, 2, … , 63) Level 2: 0j=γ00 + γ01 STEM0j+U0j 1j=γ10 + U1j
What is MLM|Random Slope Model Level1: log(Pij/(1-Pij))= β0j + β1jTutoringij +β2HS GPAij (j = 1, 2, … , 63) Level 2: 0j=γ00 + γ01 STEM0j+U0j 1j=γ10 + U1j Major 1 logit (Retention) … Major 5 Average Tutoring Effect …… Major 63 0j : 1j γ00 : Tutoring 0
What is MLM|Cross-level Model Level1: log(Pij/(1-Pij))= β0j + β1jTutoringij +β2HS GPAij (j = 1, 2, … , 63) Level 2: 0j=γ00 + γ01 STEM0j+U0j 1j=γ10 + γ11 STEM0j+U1j
What is MLM|Retention in each major 63Majors RandomSlope Random Intercept
MLM|Computing Software • Specialized programs for fitting multilevel models • HLM • MLWin • General-purpose statistical software • SAS • R • Stata • Mplus
MLM|Motivations Recap. • Learning about effects that vary by higher level cluster e.g., A student support program that is more effective in some majors than others • Using all the data to perform inferences for groups with small sample size e.g., A program director wants to know how effective her program is for majors with very small number of students. • Prediction e.g., To predict a new student’s outcome
MLM|Motivations Recap. 4. Analysis of data from cluster sampling Many national surveys [e.g., PISA(the Program for International Student Assessment)] used multi-stage probability sample design. 5. Including predictors at different levels e.g., A student support program that is more effective in some majors than others due to some characteristics associated with the major such as STEM or Non-STEM. 6. Getting the right standard error The estimated standard errors of regression coefficients might be wrong when we use multiple regression to analyze multilevel data.
MLM|Good References. • Hoox, Joop (2010).Multilevel Analysis, Techniques and Applications, Routledge • http://joophox.net/mlbook2/MLbook.htm • Gelman, A., and Hill, J. (2006) Data Analysis Using Regression and Multilevel/Hierarchical Models. Cambridge. http://www.stat.columbia.edu/~gelman/arm/ • Singer, J. (2003) Applied Longitudinal Data Analysis: Modeling Change and Event Occurance. Oxford • http://gseacademic.harvard.edu/alda/ • Snijders, T., and Bosker, R. (2012) Multilevel Analysis: An Introduction to Basic and Advanced Multilevel Modeling, 2nd Ed. Sage. • http://www.stats.ox.ac.uk/~snijders/
MLM|Questions • http://csaa.ucdavis.edu/contact.html Contact us