Download
1 / 27
290 likes | 310 Views
Learn about the experimental warning program related to storm electrification, lightning mapping array, and products available in AWIPS and Google Earth. Understand the significance of total lightning activity and its relationship to severe weather, updraft size, and charge replenishment areas. Discover how lightning mapping array technology detects and maps lightning flashes, and the benefits this data offers for situational awareness and identifying storm intensities. Explore the linkage between storm strength and lightning trends for improved forecasting.

E N D
Introduction to Lightning Data 2009 Experimental Warning Program
Outline • Storm Electrification Background • Lightning Mapping Array • Products in AWIPS and Google Earth • Feedback & Surveys EWP Spring Experiment 2009
+ – Storm Electrification (Noninductive Charging)
Simplified storm charge structure • Dipole / Tripole : Normal / Inverted
Simplified storm charge structure • In-cloud and Cloud-to-ground lightning: *Disclaimer: In reality, storm charge can be much more complex than a tripole
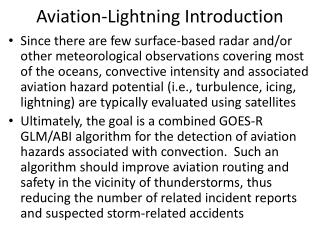
Lightning and Updraft • Total lightning activity (In-cloud [IC] and cloud-to-ground [CG]; dominated by IC) is a natural precursor to microbursts and other severe weather at the ground • updraft size and strength noninductive charging: • (updraft drives storm electrification) • IC activity will precede CG activity; areas of greatest IC activity represent areas of greatest charge replenishment: at (or just downshear from) the updraft core NSSL Laboratory Review February 17-19, 2009
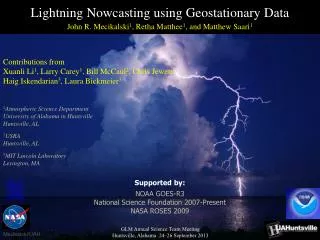
Lightning Mapping Array (LMA) • Detects VHF radiation emitted as lightning propagates • Time-of-arrival technique to determine x,y, z, and t of VHF source point • We use a minimum detection by 6 stations to include a point (reduces noise) • Accuracy: x = 6-12 m; z = 20-30 m
NLDN vs. LMA *NLDN: CG flashes Ground strike location only Gives polarity of flash *LMA: Maps points along flash IC and CG flashes Highest density of points corresponds with highest density of lightning NSSL Laboratory Review February 17-19, 2009
NLDN vs. LMA *NLDN: CG flashes Ground strike location only Gives polarity of flash *LMA: Maps points along flash IC and CG flashes Highest density of points corresponds with highest density of lightning NSSL Laboratory Review February 17-19, 2009
Animation of a lightning flash • VHF source points (3d) NSSL Laboratory Review February 17-19, 2009
Animation of a lightning flash • VHF source points (3d) NSSL Laboratory Review February 17-19, 2009
Oklahoma LMA • OKLMA • 11 stations; • spaced 10-22 km apart • First operational: May 1999 • Since 2001-2002
Washington D.C. LMA • DC LMA • 10 Stations • Operational since 2007
Northern Alabama LMA • NALMA • 10 stations • operational since Nov. 2001 NSSL Laboratory Review February 17-19, 2009
Benefits of lightning data From Williams et al (1999) • Increased Situational Awareness, Confidence Limits • Rapid Update- Potential for increased lead time, reduced FAR • Identification of intensifying and weakening storms, potential severe storms, microburst wind shears, CG threat area • Fills gaps in radar coverage (e.g., edge of radar coverage)
Linkage between storm strength and lightning • **Trends of total lightning (not just CG lightning) can give us clues to when a storm is increasing or decreasing in intensity** • (via noninductive charging) Total lightning CG only Courtesy Dennis Buechler
Data in Google Earth • Will be examining trends of lightning sources for each cluster in GE. • Flash “Jump” often precedes severe weather at the ground • Keep in mind: • “Jump” may not always be associated with severe weather • Can see artifacts of storms moving from edge of network to the center (increased detection efficiency)
Global Lightning Mapper (GOES-R) proxy data NSSL Laboratory Review February 17-19, 2009
GLM proxy (AWIPS) NSSL Laboratory Review February 17-19, 2009
Surveys and Feedback • Following an archive or real-time event forecasters will complete a survey evaluating the use of lightning data during that particular event. • Additional open feedback (comments, suggestions, criticisms) will occur during an event through the online EWP blog: • https://secure.nssl.noaa.gov/projects/ewp/blog/ NSSL Laboratory Review February 17-19, 2009
Questions: • Contact: Kristin.Kuhlman@noaa.gov • Experimental Warning Program: • http://ewp.nssl.noaa.gov/ • Real-time LMA: • http://lightning.nmt.edu/oklma/ • http://branch.nsstc.nasa.gov/cgi-bin/LMAdp.pl • http://branch.nsstc.nasa.gov/PUBLIC/DCLMA NSSL Laboratory Review February 17-19, 2009
Linkage between storm strength and lightning • **Trends of total lightning (not just CG lightning) can give us clues to when a storm is increasing or decreasing in intensity** (via noninductive charging)