Download
1 / 19
260 likes | 410 Views
Accuracy Assessment. Validating an Electronic Land Cover Map. AA_Vis_1. Using the software “MultiSpec,” students follow protocols to prepare a “clustered” image of their GLOBE Study Site. Students examine the “true color” And “false-color Infrared” images

E N D
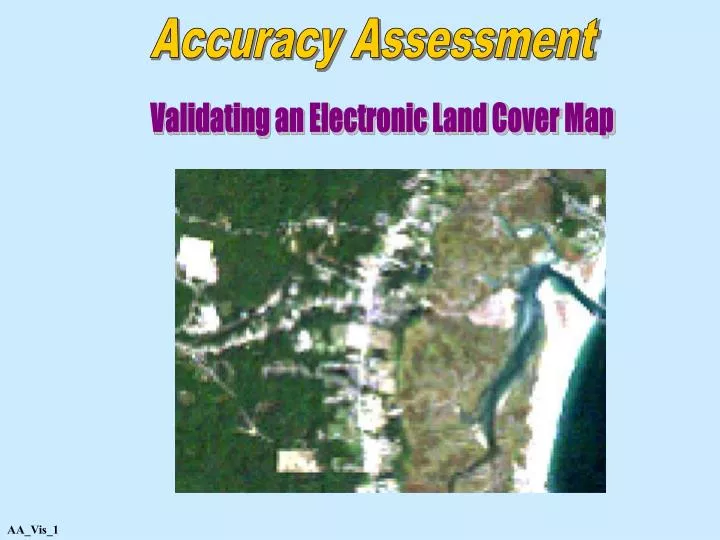
Accuracy Assessment Validating an Electronic Land Cover Map AA_Vis_1
Using the software “MultiSpec,” students follow protocols to prepare a “clustered” image of their GLOBE Study Site
Students examine the “true color” And “false-color Infrared” images provided by GLOBE to identify land cover types. AA_Vis_2
Students use the “MUC System” to identify land cover types in their classified image.
Students gather data from 90 x 90 m Qualitative Land Cover Samples to check the accuracy of their map
At each of these sites, the MUC value is determined, a GPS reading is taken at the center, and photographs are taken in each cardinal direction. These are Validation Data Site 1 MUC 0222 Site 2 MUC 4522 . Site 3 MUC 93 Site 5 MUC 52 Site 4 MUC 4522 Site 6 MUC 72 Site 7 MUC 4522 Site 8 MUC 92
The Accuracy Assessment Data Work Sheet is filled out for all sites. Landing Woods 0222 0222 √ Rachel Carson_1 4522 4522 √ Burnham Plaza 91 93 √ Rachel Carson_2 4522 4522 √ Dunes Development 91 52 √ Wells Beach 72 72 √ Rachel Carson_3 4522 4522 √ Wells Corner 91 92 √
The “Difference/Error Matrix” is constructed Validation Data (What we actually found) 0222 4522 91 92 93 72 52 Total 0222 4522 91 Map Data (What we expected to find) 92 93 72 52 Total
Map and Validation data are entered on the Matrix Validation Data (What we actually found) 0222 4522 91 92 93 72 52 Total | 0222 | | | 4522 91 | | | Map Data (What we expected to find) 92 93 72 | 52 Total
Totals are calculated for rows and columns Validation Data (What we actually found) 0222 4522 91 92 93 72 52 Total | 0222 1 | | | 4522 3 91 | | | 3 Map Data (What we expected to find) 92 0 93 0 72 | 1 52 0 1 1 1 3 0 1 1 8 Total
Overall Accuracy is calculated Map Data Sum of Major Diagonal Tallies Overall Accuracy = -------------------------------------- x 100 Overall Accuracy = ----- x 100 = 63% Total Number of Samples 5 8
More Qualitative sites are visited, and the Matrix is developed for all classes on the map Validation Data 0222 4522 91 92 93 72 52 62 63 Total 12 0222 12 6 6 4522 91 14 8 4 2 Map Data 92 5 4 18 9 93 1 8 9 72 3 3 2 3 5 52 2 62 3 5 3 4 63 7 12 6 13 16 14 3 6 6 3 Total 79
Overall Accuracy is Calculated Validation Data Map Data 57 Overall Accuracy = --------- x 100 = 72% 79
Producer Accuracy is Calculated Producer Accuracy tells us how well we did in identifying Land cover types in our map. # Correctly Identified 8 Producer Accuracy = ----------------------------- x 100 = -------- = 62% 13 Column Total
User Accuracy is Calculated Validation Data User Accuracy tells us how accurate someone else would be using our data in the field # Correctly Identified 8 User Accuracy = ----------------------------- x 100 = -------- = 57% 14 Row Total
REMOTELY SENSED FOREST VEGETATION MAPS:RASTER MAPS CREATED FROMLANDSAT TM IMAGERY July 1996 Landsat TM Image Pawtuckaway Study Area, NH, USA Forest Cover Type Map from Classification of July 1996 Landsat TM Image Pawtuckaway Study Area, NH, USA Legend Class Names White Pine White Pine-Hemlock Other Conifer Hemlock Oak Red Maple Mixed Forest Nonforest Beech Other Scale Kilometers AA_Vis_13
ERROR MATRICES ANDESTIMATES OF ACCURACY AA_Vis_15