Download
1 / 45
460 likes | 481 Views
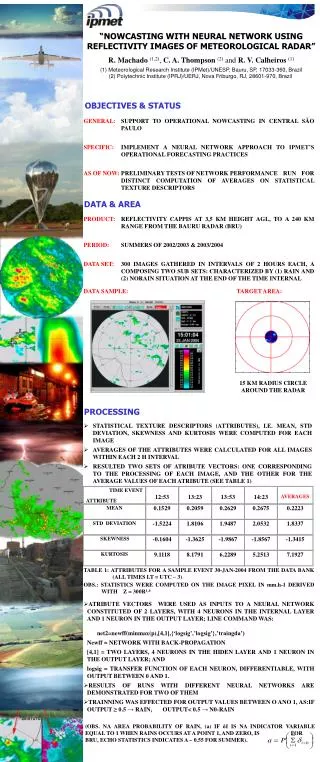
This guide covers topics such as moisture fluctuations, cloud radar, energy returned to radar, wind profilers, NEXRAD, radar pulses, volume coverage patterns, beam spreading, anomalous propagation, and more. Learn about reflectivity, velocity imagery, hail detection, and interpreting radar data, including composite and base reflectivity. Discover how radar works at different wavelengths and understand the potential effects of beam spreading and refraction. Improve your knowledge of meteorological radar and enhance your understanding of radar technology.

E N D
At a Given Wavelength Target Diversity At Different Wavelengths Moisture Fluctuations Cloud Radar (3-8 mm) ~l4 Energy Returned to Radar Wind Profilers Energy Returned to Radar NEXRAD 10-cm Spheres l-4 Size of Particle Radar Wavelength
NEXRAD or WSR-88D [Next Generation Radar] [Weather Surveillance Radar, 1988, Doppler]
Pulse Lengths for WSR-88D Radar[Weather Surveillance Radar, 1988, Doppler] • Total radiated power in a radar pulse • Range Resolution: • Long Pulse: • Short Pulse:
Volume Coverage Patterns (VCP) for the WSR-88D (NEXRAD) Radar
Volume Coverage Maps VCP-21 VCP-31
How to read the intensity scale Extreme Intense Severe Heavy Moderate Light Very light Light Precipitation Very light precipitation Fog, Clouds, Smoke Dust, Insects, Birds • The time listed is usually in UTC or Z time. To convert this to eastern daylight time, subtract 4 hours; for standard time subtract 5. • Units are decibels of Z (reflectivity). Precipitation Mode Scale Clear-Air Scale
Clear-Air Mode Gulf Coast Sea-Breeze (South of Tallahassee)
INTERACTION BETWEEN A WILDFIRE AND A SEA-BREEZE FRONT Hanley, Cunnigham, and Goodrick
Ground Clutter • Most prevalent on 0.5° reflectivity and velocity images • Radar beam is striking stationary ground targets • Usually appears as an area of uniform returns surrounding radar site • Velocities usually near zero on velocity images • Some is filtered but it is impossible to remove it all • Especially bad during inversions or after frontal passages
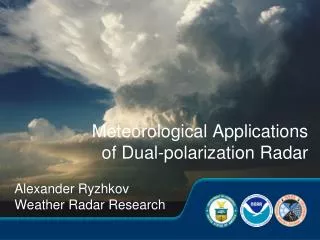
Beam Spreading • The beam widens as it moves away from the radar. If a small storm is a considerable distance from the radar...it may not be big enough to completely fill the beam. • Since the radar cannot discern things thinner than the beam, it assumes the storm is filling it entirely. This can make a storm look bigger than reality. Actual Depicted
Beam Height vs. Distance • Lowest elevation slice is 0.5° so it is not totally horizontal. • Earth’s curvature also plays a role. • Radar beam gets higher off the ground farther from the radar. • Makes low level precipitation invisible to radar at considerable distances.
Anomalous Propagation Greater density slows the waves more. Less dense air does not slow the waves as much. Since density normally decreases with height, the radar beam is refracted toward the surface of the Earth.
Subrefraction If the decrease in density with height is more than normal, then the beam bends less than normal and this is called subrefraction. In this case the beam might shoot over the target and miss the precipitation.
Superrefraction If the decrease in density with height is less than normal, then the beam bends more than normal and this is called superrefraction. In this case the beam bends more toward the surface of the Earth, and it may undershoot the target.
Ducting If the decrease in density with height is much less than normal, the beam may bend down to the surface of the Earth in a process called ducting. If the beam is backscattered to the receiver, it may result in Anomalous Propagation (AP) or “false echoes”.
Products Available • Reflectivity Images • Velocity Images (Doppler) • Precipitation Estimates • Vertically Integrated Liquid • Echo Tops • Animated Loops of Most Products • Many Other Products
Reflectivity Images Base Reflectivity and Composite Reflectivity Base Reflectivity Composite Reflectivity • Displays the maximum returned signal from all of the elevation scans • Better summary of precipitation intensity • Much less deceiving than Base Reflectivity • Subtle 3-D storm structure hidden • 0.5° elevation slice • Shows only the precipitation at the lowest tilt level • May underestimate intensity of elevated convection or storm cores
Reflectivity Images Composite Reflectivity • Displays the maximum returned signal from all of the elevation scans to form a single image • Can often mask some Base Reflectivity signatures such as a hook echo
Base vs Composite Reflectivity Which is which? Base Reflectivity Image Composite Reflectivity Image • Notice the heavier returns and more coverage • Notice the lighter returns
Velocity Imagery Warm colors are winds moving away from radome (reds, +) Cool colors are winds moving toward radome (greens, -) Wind speed is in knots Tight area of opposing winds (+ and -) can indicate convergence or rotation. Circled area called a couplet. Indicates a possible tornado.
Detecting Rotation A velocity couplet may indicate rotation. + (radar site) outound radial velocities inbound radial velocities X
Detection Rotation (Cont.) Not all velocity couplets indicate rotation. inbound radial velocities + (radar site) outbound radial velocities Linear (straight line) flow over the radar site.
Hail Detection • Returns > 55 dBz usually indicate hail. • However, the probability of hail reaching the ground depends on the freezing altitude. • Usually, a freezing level above 14,000 feet will not support much hail. • This is because the hail melts before reaching the ground. • Freezing level can be determined from an upper air sounding.
Hail? Max return of 60 dbZ Max return of 65 dbZ Freezing level was 7,000 feet Freezing level was 17,000 feet Produced golfball sized hail Produced no hail Hence, hail production depends directly on freezing level.
Vertically Integrated Liquid (VIL) • Take a vertical column of the atmosphere: estimate the amount of liquid water in it. • High VIL values are a good indication of hail. • The white pixel indicates a VIL of 70. • This storm produced golfball size hail. • Trouble with VIL is that the operator has to wait for the scan to complete before getting the product.
The Hail Spike Also called Three-Body Scattering • A dense core of wet hail will reflect part of the beam to the ground, which then scatters back into the cloud, and is bounced back to the antenna. • The delayed returns trick the radar into displaying a spike past the core. • Usually, will only result from hail 1 inch in diameter or larger (quarter size).
Echo Tops Fairly accurate at depicting height of storm tops Inaccurate data close to radar because there is no beam angle high enough to see tops. Often has stair-stepped appearance due to uneven sampling of data between elevation scans.
Precipitation Estimates An incredibly powerful tool to the meteorologist Storm TotalPrecipitation • Total estimated accumulation for a set amount of time. • Totals are in inches • Time range is sometimes listed on image. • Resets storm total whenever there is no rain detected for an hour.
One Hour Precipitation Total • -Updated once per volume scan. • Shows accumulated rainfall for the last hour. • Useful for determining rainfall rate of ongoing convection.
Precipitation Estimate Advantages and Limitations • Great for scattered areas of rain where no rain gauges are located • Has helped issue flash flood warnings more efficiently • Helps fill in the holes where ground truth information is not available • Much better lead time for warnings • Provides a graphical ‘map’ of rainfall for an entire region • Data can be overlaid with terrain and watersheds to predict reservoir and waterway crests • Estimates based on cloud water levels and not ground level rainfall • ‘Hail Contamination’ causes highly inflated values • High terrain causes underestimates • Lower resolution than reflectivity images • Useful as a supplement, not replacement for ground truth information
How Doppler Wind Is Displayed Inbound velocities (towards the radar) are shaded blue, with pale shades for light winds and dark shades for strong winds. Outbound velocities (away from the radar) are shaded orange with pale shades (yellow) for light winds and dark shades (red) for strong winds.
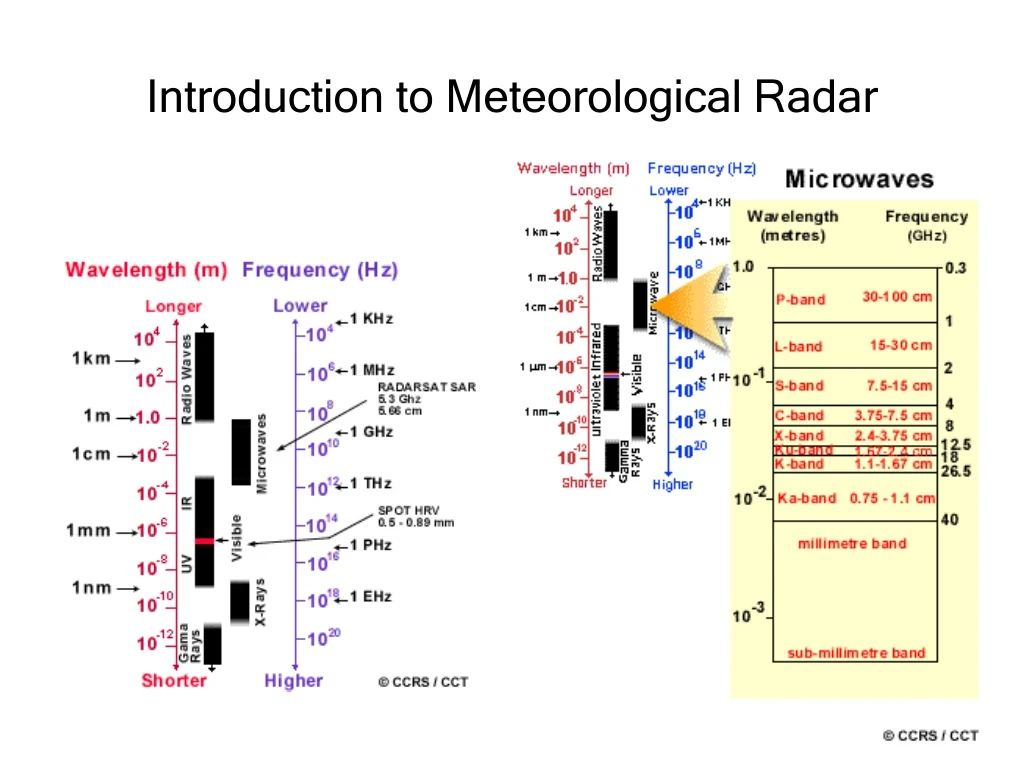
94 GHz 35 GHz Maximum Propagation Distance Energy Absorbed by Atmosphere 10-15 km 20-30 km 3.2 mm 8 mm Radar Wavelength
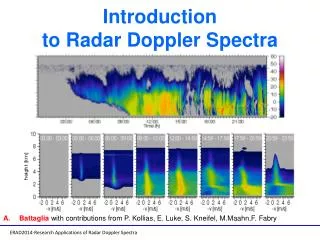
Cloud Radar Data from Southern Great Plains 20-km Black Dots: Laser Measurements Of Cloud Base Height 10-km Surface time 7:00 pm 7:00 am 7:00 pm Small Cloud Particles Typical Cloud Particles Very Light Precipitation
Cloud Radar Data from Southern Great Plains 20-km Black Dots: Laser Measurements Of Cloud Base Height 10-km Insects Thin Clouds Surface time 7:00 pm 7:00 am 7:00 pm Small Cloud Particles Typical Cloud Particles Very Light Precipitation