Download
1 / 10
100 likes | 217 Views
Statistics. Consider the results form a class quiz: Boys : 54, 84, 70, 72, 92, 32, 92, 78, 80 Girls : 52, 74, 84, 94, 70, 68, 88, 80 Put the data in order from least to greatest: Boys: Girls:. To summarize the data, we use measures of central tendency :

E N D
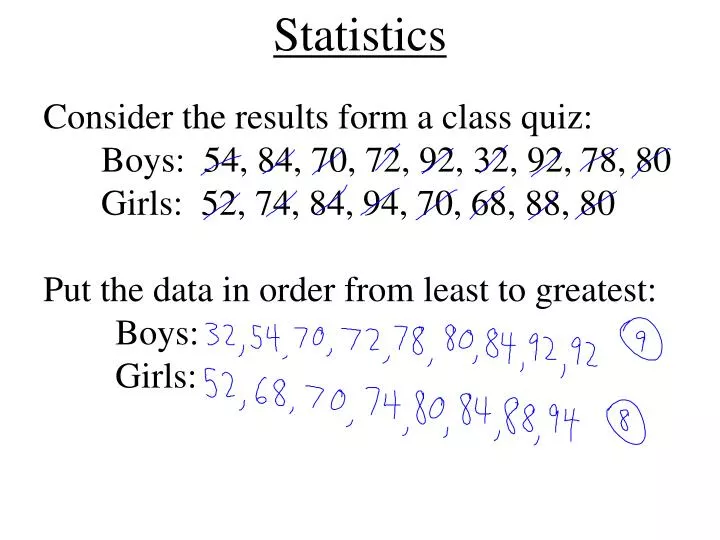
Statistics Consider the results form a class quiz: Boys: 54, 84, 70, 72, 92, 32, 92, 78, 80 Girls: 52, 74, 84, 94, 70, 68, 88, 80 Put the data in order from least to greatest: Boys: Girls:
To summarize the data, we use measures of central tendency: Mean: (a.k.a. average) add up the numbers and divide by the number of data Mean (boys) =
Median: the middle number when the data is written in order If there is an even amount of data, average the two middles Median (boys) =
Mode: the number that occurs most frequently in the data There may be no mode or several modes Mode (boys) =
To tell how spread out the data is, we use measures of dispersion: Range: the difference between the largest and smallest numbers in the data Range = (greatest value) – (least value) Range (boys) =
Standard Deviation: describes the typical difference between the mean and a data value Std. Dev. (boys) =
To help us visualize the data, we can use a Box & Whisker Plot • Put the data in order from least to greatest. • Find the minimum and maximum values • Find the median • Find the Lower Quartile (median of the lower half of the data) • Find the Upper Quartile(median of the upper half of the data) • Plot the five values on a scaled number line • Draw the boxand whiskers
Ex. For the girls scores, find the following: Mean: Median: Mode: Range: Standard Deviation: Box-and-whisker Plot:
Please do the review and finish it at home. This is the last lesson from the chapter, the test will be on next class.