Download
1 / 7
90 likes | 154 Views
Learn about contingency table analysis and its significance in statistics to determine correlation between factors like smoking and lung cancer. Understand how to conduct a chi-square test for independence and interpret the results effectively.

E N D
Contingency Table Analysis: a chi-square test for independence (or test for association)
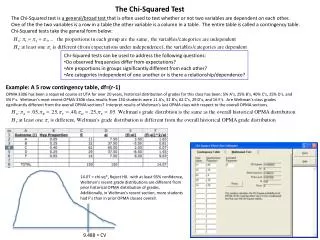
Contingency table analysis • Contingency table analysis is an important analysis method in statistics. • It can be used to inference whether one factor is correlated with another factor. • For example, “Does smoking cause a lung cancer?” • Let S=1 denote that a person smoke, and S=0 denotes that the person does not smoke. • Let L=1 denotes that the person suffers from a lung cancer, and L=0 denotes that the person does not have a lung cancer. • Table 1 is a contingency table (列聯表), Table 2 shows the corresponding Probability of each cell.
If the two factors are independent (H0), P(S=s, L=l)=P(S=s)*P(L=l) for s=0,1 and l=0,1. • We know that P(AB)=P(A)*P(B) if events A and B are independent. • For table 2, we have
We can estimate P1* to be 27/44 by referring to Table 1. • Similarly, 9/44 for P0*. • According to Equation 1, we can estimate P11 to be 27/44 * 9/44. • If H0 holds, the number of persons in cell 1 can be estimated at 44*P11, which is 44*27/44*9/44=27*9/44
Denotes an observation in cell i by Oi, and an estimate of cell i by Ei, we have
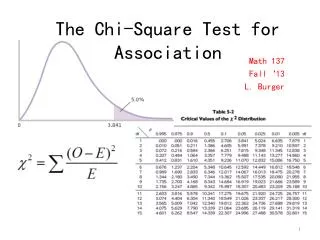
We have, • Check the table of Chi-square table, if the value cannot be seen very often ( p-value is small), then reject H0 and conclude that the two factors are correlated. • The p-value for this case is 0.057; depending on your significant level α, you can decide whether reject H0 or not.
In general, if the contingency table has r rows and c columns of cells, we have