Download
1 / 30
300 likes | 313 Views
The Braidwood Reactor Neutrino Experiment Jonathan Link Virginia Polytechnic Institute Workshop on Future PRC-U.S. Cooperation in High Energy Physics June 12, 2006. Reactor Experiment Basics. ν e. ν e. ν e. ν e. ν e. ν e. ν e. ν e. ν e. ν e. ν e. ν e.

E N D
The Braidwood Reactor Neutrino Experiment Jonathan Link Virginia Polytechnic Institute Workshop on Future PRC-U.S. Cooperation in High Energy Physics June 12, 2006 Jonathan Link, Virginia Tech PRC/US Cooperation in HEP Workshop
Reactor Experiment Basics νe νe νe νe νe νe νe νe νe νe νe νe Oscillations observed as a deficit of νe sin22θ13 πEν/2Δm213 Well understood, isotropic source of electron anti-neutrinos Detectors are located underground to shield against cosmic rays. 1.0 Unoscillated flux observed here Probability νe Distance (L) 1500 meters Jonathan Link, Virginia Tech PRC/US Cooperation in HEP Workshop
Braidwood Neutrino Collaboration 14 Institutions 70 Collaborators Jonathan Link, Virginia Tech PRC/US Cooperation in HEP Workshop
Reactor Experiment Requirements • The goal of next generation reactor experiments is to achieve sensitivity to sin22θ13 of better than 0.01 (Current limit sin22θ<0.13 at 90% CL). To achieve this goal we need to… • Reduce background rate to a few percent of neutrino signal in the far detector. • Go deep underground & Reject backgrounds. • Understand remaining background to less than a 0.2% of signal. • Tag background events for rejection and study. • Know the relative normalization/efficiency of near and far detectors to better than 0.3%. • Movable detectors for cross calibration. Jonathan Link, Virginia Tech PRC/US Cooperation in HEP Workshop
Braidwood Design Principles • Compare rate/shape in identical, large, spherical, on-axis detectors at two distances that have equal overburden shielding(Multiple detectors at each site: two near and two far) • Systematic uncertainties cancel to first order and only have uncertainties for second order effects • Detectors filled simultaneously with common scintillator on surface • Large (65 ton target) detectors give large data samples • Spherical detectors to reduce any geometrical effects from neutrino direction and reconstruction • On-axis detectors eliminate any dependence on reactor power variations in a multi-reactor setup. • Equal overburden shielding gives equal spallation rates in near and far that can be exploited for detector and background checks Jonathan Link, Virginia Tech PRC/US Cooperation in HEP Workshop
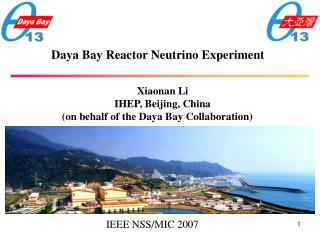
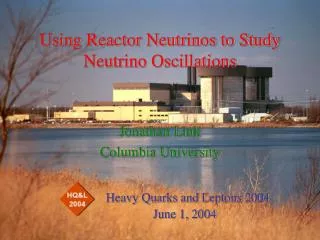
Braidwood Nuclear Station Located about 30 miles due south of the Fermilab. Owned and operated by Exelon Nuclear. • 2 Reactors with a total of 7.17 GW thermal power • Well understood/favorable geology • Plant construction data • Site investigation (completed Jan. 05) • Strong support from owner • Ability to optimize layout Far Detector Near Detector Jonathan Link, Virginia Tech PRC/US Cooperation in HEP Workshop
Recent Geological Site Investigation Water Pressure Testing Sand and clay ……………….. 37' Carbondale Shale & Sandstone Maquoketa Shale ………………… 140' Maquoketa Limestone ………………… 207' Maquoketa Shale ………………… 271" Galena Limestone & Dolomitic Limestone ………………… 467" Platteville Limestone & Dolomitic Limestone NO TAKE Zones Depth 410 to 450 Depth 450 to 490 Depth 490 to 530 Depth 530 to 570 Depth 570 to 610 Depth 590 to 630 Audio Televiewer and Geophysics Suite GZA GeoEnvironmental, Inc. Jonathan Link, Virginia Tech PRC/US Cooperation in HEP Workshop
Background Radiation at Depth One of the standard geophysics probes measures the natural gamma radiation. It’s intended to measure rock porosity. Confirms expectations that the background radiation in dolomitic limestone is relatively low. Near Shaft Far Shaft GZA GeoEnvironmental, Inc. Jonathan Link, Virginia Tech PRC/US Cooperation in HEP Workshop
Braidwood Baseline Design: Site Layout • Near detectors at a baseline of 285 meters (~4400 int/day) • Far detectors at a baseline of 1500 meters (~160 int/day) • All detector at a depth of 183 meters (600 ft) • Earth shielding is flat with an vertical cover of 464 mwe (as measured by our bore hole geological investigation) • This should be compared to ~700 mwe cover under a mountain! Jonathan Link, Virginia Tech PRC/US Cooperation in HEP Workshop
Baseline Optimization • The baseline optimization is sensitive to three effects: • Oscillation wavelength (πEν/Δm2) • Event statistics which fall off like 1/L2 • The level of systematic error (S/N is a function of L which also varies as 1/L2) Optimize in terms of the Δm2 invariant, kinematic phase, and the percent of systematic error in terms of statistical error. With Δm2=2.5×10⁻³ and systematic error at 150% of statistical error… L≈1500 meters Kinematic Phase = 1.27Δm2L/E Jonathan Link, Virginia Tech PRC/US Cooperation in HEP Workshop
Optimization for Shape vs. Rate Statistics Limited Systematics Limited Systematic Error = 200% Systematic Error = 0% Systematic Error = 600% • The optimal Baseline for the systematics limited shape analysis is ~40º. • The optimal baseline for the systematics limited counting experiment is at the least optimal spot for a shape analysis! Jonathan Link, Virginia Tech PRC/US Cooperation in HEP Workshop
Braidwood Baseline Design: Detectors • Two zone design • 2.6 meter target radius • 65 ton target • 3.5 meter total radius • 1000 PMT’s (coverage >25%) • 0.2% Gd Loaded Scintillator 2.6 m 3.5 m Spherical design minimizes surface related BG and inefficiency, position dependence, buffer volume, and neutrino directional effects. Jonathan Link, Virginia Tech PRC/US Cooperation in HEP Workshop
Calibration fromneutron capture peaks 0.1%uncertainty Two Zone Detector Design • Two zone design offers simpler construction, • optics, and source calibration, as well as larger fiducial mass for a given detector volume. • Large (r = 3.5 m) detector reduces surface area to volume ratio, significantly reducing sensitivity to energy scale. • Use neutron capture peaks from inverse β-decay events to measure energy scale. • In each far detector, E scale can be measured to 0.3% every 5 days. (This calibration averages over detector in exactly the same way as signal events.) • Acceptance uncertainty from energy scale in 2-zone design should be ~0.1%. Jonathan Link, Virginia Tech PRC/US Cooperation in HEP Workshop
Backgrounds The majority of backgrounds are directly related to cosmic rays (cosmogenic). • There are three types of background • Random coincidence ─ where two unrelated events happen close together is space and time. • Fast neutron ─ where a fast neutron enters the detector, creates a prompt signal, thermalizes and is captured. • β+n decays of spallation isotopes ─ isotopes such as 9Li and 8He with β+n decay modes can be created in a spallation with μ on 12C. Jonathan Link, Virginia Tech PRC/US Cooperation in HEP Workshop
Random Coincidence Background The rate of single events is shown on the left. Integrate plot in the positron and neutron signal regions to get the random rates. Positron-like:142k/det/day Neutron-like: 5070/det/day Assuming KamLAND concentrations of 40K, 232Th and 238U and 450 mwe The ordered random coincidence of these events in 100 μs window is0.8/detector/day. Reverse order events give a handle on the background rate Increasing 238U & 232Th by orders of magnitude is a small effect. Jonathan Link, Virginia Tech PRC/US Cooperation in HEP Workshop
Fast Neutron Backgrounds There are three processes for the prompt “positron-like” events • Two neutron captures from the same cosmic ─ This should be tagged the vast majority of the time, but it sets the tag window for tagged muons at 100 μs. • Proton recoil off fast neutron ─ dominate effect. • Fast neutron excitation of 12C ─ interesting, but not significantly different than 2. Energy spectrum peaks at particular values (like 4.4 MeV, first 12C excited state) Jonathan Link, Virginia Tech PRC/US Cooperation in HEP Workshop
Veto Detectors p n n m m Tagging Muons at Braidwood The basic idea is to tag muons that pass near the detector so that we can reject the fast neutron background. Neutrons from farther away should mostly be ranged out. • What eludes the tagging system? • Veto inefficiency ─ 99% efficiency →0.25/detector/day • Fast neutron created outside the shielding ─0.5/detector/day Shielding With μrate in the tag system of 21 Hz and the tag window of 100 μs →0.2% dead time 6 meters Jonathan Link, Virginia Tech PRC/US Cooperation in HEP Workshop
m m Comments on 9Li Production Hagner et al. measured σ(μ+12C->9Li+X) assuming 9Li was produced directly in μ-nucleon interactions: 9Li However, it seems unlikely to produce 9Li directly for Eμ>10 GeV. From our studies, it appears the production is a secondary of tertiary process: Deep inelastic scattering n p 9Li 12C(n,n3p)9Li Jonathan Link, Virginia Tech PRC/US Cooperation in HEP Workshop
What did Hagner Measure Anyway? Hagner measured 9Li production in scintillator target cell from 190 GeV muons. Result: This is geometry dependent and hence not really a cross section! However, can use this to extract a cross section for 12C(n,n3p)9Li. Jonathan Link, Virginia Tech PRC/US Cooperation in HEP Workshop
Analog of Hagner Setup Using Braidwood G4 MC 20 million incident muons gives: 14 9Li events in target cell 47 9Li event in Z slice. Number of events in target cell corresponds to =2.2 b consistent with Hagner Therefore using Hagner cross section underestimates the total number of 9Li by a factor of three! Rock 240 cm Shield 100 cm Vessel Z slice Buffer 88 cm Target Cell Jonathan Link, Virginia Tech PRC/US Cooperation in HEP Workshop
Fitting for 9Li in Time Our simulations show that the vast majority of 9Li production is associated with a muon that deposits >1 GeV in the detector. The 9Li events have a half-life of 178 ms while the reactor event half life is determined from the rate of high deposited energy (showering) μ events. So the time distribution can be fit to two exponentials to determine the 9Li contribution. Time of Candidate Events since last μ > 1GeV Jonathan Link, Virginia Tech PRC/US Cooperation in HEP Workshop
Energy Spectrum Fit Fitting the energy spectrum takes advantage of the significant differences between the signal and backgrounds. Use tagged background events to measure the background energy spectra in the detector and then fit candidate spectrum for the untagged background contributions. > 3M events/near det Neutrino Energy 9Li ~3M singles events/det ~12K events/det Tagged 1800 events/det Tagged Fast Neutron Random Jonathan Link, Virginia Tech PRC/US Cooperation in HEP Workshop
Relative Normalization In the relative normalization many sources of uncertainty cancel. Remaining uncertainty must be less than 0.3%. For a robust/believable result, need at least two independent ways to determine or constrain the remaining uncertainties Jonathan Link, Virginia Tech PRC/US Cooperation in HEP Workshop
Movable Detectors for Cross Calibration νe νe νe νe νe νe νe νe νe νe νe νe Spending just 8% of the run on head-to-head calibration (where two detectors sit next to each other in high flux of near site) results in a free proton calibration precision of better than 0.3%. Detector calibration techniques can be verified against head-to-head neutrino relative calibration. Detectors are built and filled on the surface, facilitating a rapid deployment. Jonathan Link, Virginia Tech PRC/US Cooperation in HEP Workshop
Beta decays t1/2 = 20ms (can tag to muon) 13.4 MeV endpoint 12B Using Isotope Production As Addition Cross Check • Unique feature of the Braidwood set up: • Near and Far detectors at equal well-understood overburden • Near and Far detectors have substantial shielding • Can use produced 12B events to check: • Near/far relative target mass from the total rate • Near/far energy calibrations from the relative • energy distribution • ~50,000 12B beta-decay events per year per detector can be tagged and isolated for a statistical uncertainty of 0.45% • Systematic uncertainties related to the relative near/far overburden needs to be known to few percent from: • Geological survey information (Bore hole data: near/far agreement at <1%) • Cosmic muon rates in the near and far locations Jonathan Link, Virginia Tech PRC/US Cooperation in HEP Workshop
For three years of Braidwood data and Δm2≈ 2.5×10⁻³ eV2 90% CL limit at sin22θ13 < 0.005 3 σ discovery for sin22θ13 > 0.013 Braidwood Projected Sensitivity Summary of Uncertainties for a 3 year Data Run Sensitivity to sin22θ13 Jonathan Link, Virginia Tech PRC/US Cooperation in HEP Workshop
Conclusions The measurement rests on the ability to understand the near/far relative normalization and to mitigate and measure backgrounds. Each contribution to the relative normalization should be measured and verified by at least two independent methods. This redundancy is critical to ensure that the high precision goals of the experiment can be meet. Background reduction is achieved by tagging muons and shielding the detector from spallation products of untagged muons. 9Li is tagged by muon energy deposition in the detector. Jonathan Link, Virginia Tech PRC/US Cooperation in HEP Workshop
Conclusions All background sources can be fit for using energy spectra derived from the tagged samples. The overall three year sensitivity goal was sin22θ13< 0.005 at Δm2 = 2.5×10⁻³. Jonathan Link, Virginia Tech PRC/US Cooperation in HEP Workshop
Question Slides Jonathan Link, Virginia Tech PRC/US Cooperation in HEP Workshop
Detectors Designed to Move The detectors need to carry electronics and front-end DAQ as these components also play a role in detector efficiency. Multiple far detectors may be used to maintain portability while increasing total volume. Detectors need to fit in the shaft (Diameter ≤7 meters) Detector 9 meters ► 8 meters Jonathan Link, Virginia Tech PRC/US Cooperation in HEP Workshop