Download
1 / 24
240 likes | 397 Views
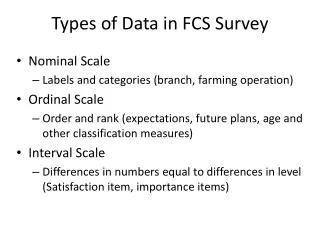
Towards a Better Integration of Survey and Tax Data in the Unified Enterprise Survey. Claude Turmelle Statistics Canada ICES-III Montréal, Québec, Canada June 18-21, 2007. Outline. Overview of the UES Characteristics of the target population Current use of tax data At sampling

E N D
Towards a Better Integration of Survey and Tax Data in the Unified Enterprise Survey Claude Turmelle Statistics Canada ICES-III Montréal, Québec, Canada June 18-21, 2007
Outline • Overview of the UES • Characteristics of the target population • Current use of tax data • At sampling • At imputation • At estimation • Issues and Challenges • Towards a better use of tax data • Conclusion
Overview of the UES • Unified Enterprise Survey (UES) started in 1997 • Objectives • Integrate all annual business surveys into one unified survey framework • To produce quality financial and commodity estimates • National and sub-national levels • Industrial levels
Overview of the UES • Target population • All Canadian businesses within the covered industries • The UES is an Establishment based survey • Coverage over time • 1997: Seven Industries • 1998: Sixteen more (including Wholesale) • 1999: Four more (including Retail) • 2000: Four more (including Manufacture) • …. • 2007: Now covers over 60 major industries
Characteristics of the Target Population • Divided into two main types of businesses: unincorporated (T1) and incorporated (T2) • General Index of Financial Information (GIFI) data are available electronically for the entire T2 population • T1 data are only available electronically for about half the T1s (e-filers)
Characteristics of the Target Population • An enterprise is • Complex:Multi-provincial and/or Multi-industry and/or Multi-legal • Simple: The opposite • An enterprise is also • Single:Only one establishment • Multi: More than one establishment • Simple-Single enterprises represent about 95% of the population, although only about 40% of the economy
Current Use of Tax Data • Why would someone use tax data? • Improve efficiency of the sample design • Reduce the response burden • Reduce the collection cost • Improve quality of the estimates
Current Use of Tax Data • At sampling • Some key variables taken from different tax files are put on the sampling frame • Total Revenue, Total Expenses from GIFI • Total Sales from Goods & Services Tax (GST) • Salaries & Wages, # Employees from Payroll Deductions (PD7) • Used to define a size measure (Total Revenue) for each establishment on the frame • Used to stratify the population by size and to define the Take-None (T-N) portion
Current Use of Tax Data • At imputation • Used to replace survey data (financial variables) for a predetermined sub-sample of selected Simple-Single units • Also used to replace survey data for some non-respondents • Used as auxiliary data during imputation
Current Use of Tax Data • At estimation • GIFI data are used to produce estimates for all T2 units falling in the T-N portion • T1 e-filer data are used to produce estimates for all T1 units falling in the T-N portion
UES Survey Design at a Glance T1 T2 Main sample to be surveyed Main sample to be surveyed Not eligible for tax : full questionnaire Characteristic quest. (services surveys) or full questionnaire (other surveys) Tax replaced EXCLUSION THRESHOLD For variables available from tax: Total estimate = Survey estimate (T1,T2) + T2 Take-None + T1 Take-none e-filer estimate For variables not available from tax (Characteristics): Total estimate= Survey estimate (T1, T2) T1 Take-None: Sample of e-filers T2 Take-None: Census of GIFI
Issues and Challenges • At sampling • Sometimes we get inconsistent tax data • Ex: GIFI Total Revenue=$2M GST Total Sales=$25M • What do we do? • We use a conservative approach, i.e. we take the maximum • We manually verify and adjust the extreme cases (we’ll make use of survey data if available)
Issues and Challenges • At sampling (cont’d) • Sometimes all we get is # Employees or Salaries & Wages (Revenues = . or $0) • What do we do? • We model Total Revenue using what’s available
Issues and Challenges • At imputation • Sometimes we can’t find the link to tax data (ex.: not-for-profit organizations) • Sometimes we link to 2 or more tax files • We currently use direct tax replacement (i.e. Ysurvey = Xtax). Should we instead use a modelling approach (i.e. Ysurvey = f(Xtax)? • Studies have shown that in some cases it might be more appropriate to use f(X)
Issues and Challenges • At estimation • Currently, we use the one-phase Horvitz-Thompson estimator • It’s a very simple, and fairly efficient estimator • Unfortunately, it could be severely biased if the model y = x doesn’t hold
Issues and Challenges • At estimation (cont’d) • Estimates for variables not available from tax file (characteristics/commodity) do not cover the T-N portion • For some characteristics the T-N portion can count for a lot more than 10%
Issues and Challenges • Data quality • Response rates (What is a respondent?) • Respond to tax but not to the characteristic questionnaire • Reported tax data vs imputed tax data • Planned tax replacement vs tax replacement for non-response • Variance & CV • A lot of imputation occurs in the current strategy (incl. tax replacement) • Shouldn’t we include the variance due to imputation?
Towards a Better Use of Tax Data • Understand the particularities of the different tax data sources (ex.: GST vs T2 is currently under investigation) • Explore different administrative files to help with particular sub-populations (ex.: not-for-profit organizations)
Towards a Better Use of Tax Data • Keep investigating why Ysurvey ≠ Xtax even when they should conceptually be equal • Explore the idea of using Ysurvey = f(Xtax) • Fine-tune our definition of who is eligible for tax replacement and who is not • Currently studying the possibility of using a more robust estimator to protect against the potential bias • Developing a strategy to cover the entire population for all variables of interest
Towards a Better Use of Tax Data • Start taking into account the variability introduced by imputation when computing variances and CVs • A framework is under development to define response rates when both tax data and survey data are used for the same units • Explore the possibility of making use of all the GIFI data, not only for the T-N and the sample
Towards a Better Use of Tax Data Eligible Ineligible T1 T2 Main sample to be surveyed Not eligible for tax : full questionnaire Characteristic quest. (services surveys) or full questionnaire (other surveys) Tax replaced EXCLUSION THRESHOLD For variables available from tax: Total estimate = Survey estimate (T1,T2) + T2 Take-None + T1 Take-none e-filer estimate For variables not available from tax (Characteristics): Total estimate= Survey estimate (T1, T2) T1 Take-None: Sample of e-filers T2 Take-None: Census of GIFI
Conclusion • Since the introduction of the UES, the use of tax data has increased consistently • It has significantly reduced response burden and the cost of the survey • Unfortunately, sometimes at the expense of a reduced data interpretability • Fortunately, it was recently decided that we would take a few steps back to evaluate how we currently do things, and to determine how we could improve our strategy
Claude Turmelle (613) 951-3327 claude.turmelle@statcan.ca