Download
1 / 26
260 likes | 395 Views
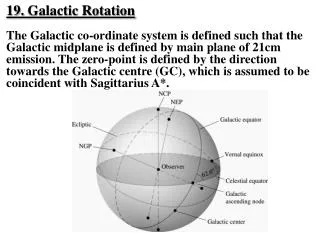
A 9-Year Summary of Radar Characteristics of Mesocyclonic Storms and of Deep Convection in Southern Quebec (1993-2001). Mesocyclone : Small-scale (~ 5 km) rotation over a Sufficient depth (> 2.0 km) and Lasting at least 10 minutes

E N D
A 9-Year Summary of Radar Characteristicsof Mesocyclonic Storms and ofDeep Convection in Southern Quebec (1993-2001) Mesocyclone: Small-scale (~ 5 km) rotation over a Sufficient depth (> 2.0 km) and Lasting at least 10 minutes UVIL : Vertical integration of Z4/7 from a height of 5 km
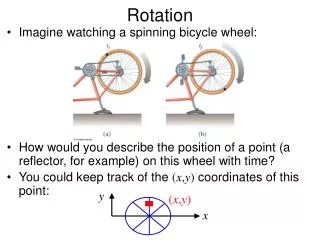
Example of severe weatherMESOCYCLONES: small-scale rotating flows Mesocyclone radar signature Radar Mesocyclone flow
2.5 km CAPPI 7.0 km CAPPI UVIL: From 5.0 km VIL: from 2.5 km
2.5 km Doppler CAPPI 2.5 km Refl. CAPPI
2.5 km Reflectivity CAPPI 3.0 km Doppler CAPPI 20:30 GMT 28-Aug-1994
Climatology of Mesocyclones Yearly distribution of the tracked mesocyclones and of the 'mesocyclone hours'
Climatology of Mesocyclones Distribution of the lifetime of the tracked mesocyclones and of their path length
Distribution of the diameter and of the vertical depth of the 'm5' detections that are part of the tracked mesocyclones
Distribution of the peak rotational velocity and of the average maximum shear (as defined in section 3.4a) of the 'm5' mesocyclones
Hourly and monthly distribution of mesocyclones in the Montreal area.
Climatology of Mesocyclones Geographical distribution of mesocyclonic vortices around the McGill Doppler radar for 1993 to 2000 inclusively. Range rings are 20 km apart. Divide the "Mesos" scale by 10 in order to obtain the number of mesocyclones affecting each pixel of the map.
Planetary scale precursors Day before Thunderstorm days with mesocyclones (22 days) Thunderstorms days without mesocyclones (27 days) Same day Composite 500 hPa maps. Thin solid lines are heights [decameters]. Thick solid (dashed) positive (negative) anomalies from 30 years climatology. Shaded is statistical significance to 95% and 99% level.
Geographical distribution of convective precipitation for each of the 9 years analyzed in terms of the number of minutes that a value of 10 kg/m2 has been exceeded on the UVIL map
Geographical distribution of deep convection for the years 1993 to 2001 inclusively in term of the number of minutes that the UVIL exceeded 15 km/m2 . Range rings are 40 km apart.
The color version of the yearly UVILs are not range-corrected
Geographical distribution of deep convection for the years 1993 to 2001 inclusively in term of the number of minutes that the UVIL exceeded 15 km/m2 . Range rings are 40 km apart.