Download
1 / 12
120 likes | 143 Views
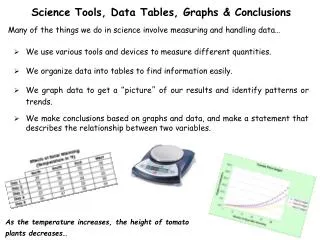
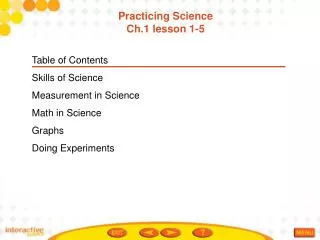
Learn to choose and create bar graphs, line graphs, pie charts, and scattergrams for effective data visualization in science.

E N D
Graphs IN SCIENCE Bar Graph, Line Graph, Pie Chart & Scattergram
Graphing is all about DECISIONS! • Which sort of graph to draw? • Bar graph • Line graph • Pie chart • Scattergram • What are the variables for the X and for the Y axes? • Dependent variable – on Y axis • Independent (manipulated) variable – on X axis • What scale intervals to use? • X and Y axes can be different • Do you need to start the scale from 0?
Advice • Use an HB (possibly H) pencil • Use a ruler • Plot points should be small x’s or •’s • Plot lines are usually drawn straight with a ruler, from centre of plot to centre of plot • Do not use colours or pens until the end – for labelling and titles • Use a graph size and scales which fill the page but leave sufficient space for labelling
Bar Graph • A bar graph uses vertical or horizontal bars to display numerical information. • Bar graphs can be used to compare amounts. • Each bar is a discrete value – NOT related to any other bar • Choose an appropriate scale (with regular intervals). • The bars should have the same width. • Often bars are drawn in pairs or groups • Don’t colour in bars; rather, rule coloured bar lines
Line Graph • A line graph uses a series of plots to show changes in data over time or as some other variable changes • Plot a point for each data item, and then connect the plot points with straight lines.
A Pie Chart is a graph of percentages where the entire circle represents the whole (100%). Each wedge represents a percentage of the whole. You might need to use a protractor. Pie Chart
Example: 10%, 40%, 50% Start with 50%. 50% = ½ Now look at 40%. 40% will be almost all of the top half. 40% 10% The remainder is labelled with 10%. 50%
Plots the results from two variables – one on the X axis and one on the Y axis. A scattergram is drawn to see whether there is a relationship (CORRELATION) between the two variables. The corrleation may be shown with a TREND LINE. Sometimes colour or shapes can be used to show a third variable. Scattergram (Scatter Plot or Graph)