Download
1 / 85
850 likes | 1k Views
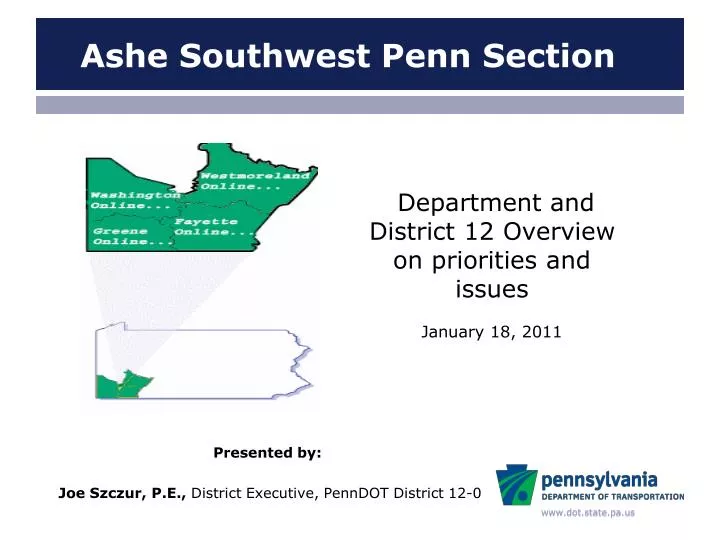
Ashe Southwest Penn Section. Department and District 12 Overview on priorities and issues January 18, 2011. Presented by: Joe Szczur, P.E., District Executive, PennDOT District 12-0. Quality Systems. Project Delivery. Maintenance/ Operations. Environmental Geo Tech Traffic Survey

E N D
Ashe Southwest Penn Section Department and District 12 Overview on priorities and issuesJanuary 18, 2011 Presented by: Joe Szczur, P.E., District Executive, PennDOT District 12-0
Quality Systems Project Delivery Maintenance/ Operations • Environmental • Geo Tech • Traffic • Survey • Right of Way • Utilities • District Maintenance • Municipal Services • Permits • - County Maintenance • - Equipment Division • -Planning &Programming • Design • Highway Design • Bridge Design • Construction • Finals • Materials • Human Resources • Fiscal • Quality • CRC ISO 9001-2008 – Project Delivery ISO 14001- Environmental
District 12 Interesting Facts • 784 employees • District 12 covers 3,627 miles of roadway. • 2,339 bridges • During winter operations, District 12 covers 8,240 miles of roadway in four counties • $238 million in 76 projects in calendar year 2010 • District 12 has: 10 Cities 190 Municipalities • Total population: Nearly 775,000
Striving to meet our Values in District 12 • SERVICE • INTEGRITY • PEOPLE • PERFORMANCE • RELATIONSHIPS • TEAMWORK/ COOPERATION
Primary Focus Areas • Bridges • Maintenance Efficiency • Project Delivery • Safety • Operations Management
Fiscal Management – Funding Breakdown Required Slide
FFY 2011 – TIP Update FFY 2009 – 2012 District 12 $680,436,122 FFY 2011 – 2014 District 12 $481,349,059 $1,318,540 Local $297,867,688 State $381,249,894 Federal $585,000 Local $162,317,435 State $318,481,624 Federal
District 12 FFY2011 TIP $481,349,059
Project Delivery • Meet let dates/Own Project Schedules • On budget • No design errors • No notice of violations
PennDOT District 12’s Top 20 Project nameEst. Let DateConsultant I-79 Restoration June 2011 SPK PA 21/ Easy Street May2011 Orth Rodgers Trafford Bridge Sept 2011 Mackin US 19 Corridor Imp August 2012 Trans Torchlight Int. May 2014 GAI I-70/I79 N-SR136 June 2014 Gannett-Flemming I-70 over SR 481 Nov 2014 McCormick/Taylor I-79/ I-70 Int. S. Junction Aug 2011 HDR I-70; SR 136-I79S Sept 2015 Gannett-Flemming I-79 Meadow Lands Jan 2011 Gannett-Fleming SR21Masontown Bridge Sept 2011 SAI SR 119 Jacobs Creek Feb 2011 SP&K SR 21Thompson Xing June 2014 SP&K US 119/819 Int. Feb 2012 AECOM (DMJM) SR 30 Jeanette Nov 20111 SP&K New Stanton Int. June 2015 URS Bentleyville Int. June 2015 MS
District 12 Major Structures Needing Work Estimated Design/Construction CostsConsultant - Contractor • (SD) Masontown (SR 21) –$65 M SAI -- • (SD) Point Marion (SR 88) – $27 M HDR Swank • (SD) Memorial (SR 119) – $19 M AERCOM Balfour • (SD) Donora-Monessen (SR 1077) –$30 M SAI J.F. Shea • (SD) Freeport (SR 356) –$65 M M&M J. B. Fay • (SD) Seward (SR 56) – $12 M L R Kimball New Enter • (SD) Trafford (SR 130) –$15 M Mackin -- • (SD) County Line (SR 119) –$21 M SPK Gulisek • (SD) Layton (SR 4038) –(Single Lane) $32 M -- Gregori • (SD) Donora-Webster (SR 1022) $40 M Baker -- • (SD) Charleroi-Monessen (SR 2018) –$40 M Baker/HDR J.B.Fay • (SD) West Newton (SR 136) –$10 M Dist 12 Clearwater • (SD) Salina (SR 1060) –(10 Ton Limit) $13 M Total $389 M (Estimated) SD area =31.1% SD= Structurally Deficient SD area with these projects 21.3% Green color = Fully Programmed on Draft TIP Orange Color = Under Construction or Complete RED = Closed Major Bridges M= Millions
Project Delivery – Meeting Let Dates • Continual evaluation of Project Status • Monitor through meetings • Project Delivery (monthly) • Letting Schedule (monthly) • In-Depth Project reviews (bi-weekly) major projects • Project Specific (as required) • Monitor through Open Plan
Project Delivery – Schedule ManagementDistrict 12 & Statewide Trend • DD006 Open Plan Portfolio on Schedule Percentage of Projects meeting baseline let dates
Project Delivery – Owning Project Schedules • Project Managers: monitor & maintain project schedules. • PMs identify & communicate issues that impact the baseline. • Portfolio Manager: evaluates schedules to maintain commitments. • Resolve issues effecting the schedule & communicates to Units when action is required. • ADE-Design: identifies & discusses project issues with: • Design Unit • District Staff (Maintenance/ Construction) • Central Office
Project Delivery – On Budget • PM’s provide completed ‘Cost Driver Analysis’ forms to the District Estimator • PM’s provide the District Estimator with project estimates more frequently on all non design build projects • District Estimator to be included in Scoping Field Views, Constructability Reviews and/or be provided with DFV reports • District Estimator to provide “planning” estimates for TIP updates beginning with the FFY 2013 update • Continue our Low Bid internal tracking report
Asset Management – Bridges • Department’s Bridge Focus Areas • Our Bridge Population • District Strategy • SD Bridges • Bridge Preservation • Inspection and Analysis Timeliness
District 12-0 Bridge Challenge • District 12 is responsible for 2,342 bridges in it’s four county area – Ranking us 4th in the state. • District 12 has both the highest percent of both SD bridges (28.31) and percent of SD deck area (25.92); compared to (28.26) and (31.10) a year ago. SR 3081
Asset Management – Bridges SD Bridges • Currently 670 (28.6%) or 1.7 Million SF (26%) • District Strategy = Risk Assessment • Rehab/Replacement utilizing a Balanced Approach • Major Bridges • Small Bridges • Department Forces • Next SD Bridges or “On-Deck” Bridges
Asset Management – Bridges Next SD Bridges • 385 bridges with Decks or Superstructures rated “5” (1.4 million SF) • 509 bridges with decks, superstructures, or substructures rated “5” (1.7 million SF)
Asset Management – Bridges Bridge Preservation • What is it? • Control SD “On Rate” • Actual Rates
Asset Management – Bridges Critical and High Priority Maintenance Needs • “Priority 0’s, 1”s and 2’s” • 2008 Initiative • POAs • Progress!
Asset Management – Bridges Structurally Deficient “On” Rate Actual Deck Area Count 2006/2007 1.6% 3.2% 2007/2008 2.8% 2.9% 2008/2009 0.2% 0.3% 2009/2010 0.7% 0.9% Desired <0.75%
Asset Management - Bridges $1.6 Billion Annual Target for ABP Program Total (typ.)
Asset Management – Bridges SD Bridge Completion Year Number Deck Area 2010 24 137,384 SF 2011 49 72,072 SF 2012 16 105,354 SF 2013 8 299,003 SF 2014 11 127,918 SF
Asset Management - Bridges Average Annual Delivery of State-owned SD Bridges (2011-2014) [based on $1.6 Billion Annual Statewide Investment] Annual Deck Area (typ.)
Asset Management – Bridge Inspections Inspection and Analysis Timeliness • Ensure on time inspection of state bridges > 8’ • Ensure on time inspection of local bridges >20’ • Ensure timely review of reports, load ratings and posting recommendations
Asset Management – Bridge Inspections • Zero tolerance goal • Utilize multiple checks/processes • BQAD monthly compliance report • Query BMS2 • Simplicity in scheduling • AAR • Locals • Notify owners 12 mos. prior to inspection • Tracking prerequisite progress
Asset Management - Bridges • Structurally Deficient Bridges • Goal: Reduce the percentage of State-owned SD bridge deck area in District 12-0 to 13.7% by 2033 (25 year program beginning 2008) District 12 Goal – 13.7% SD Deck Area
Asset Management - Bridges • Structurally Deficient Bridges • Goal: Reduce the number of State-owned SD bridges in District 12-0 to 326 bridges (13.9%) by 2033 (25 year program beginning 2008) District 12 Goal – 326 SD Bridges
Sustainability - Smart Transportation • Identify District’s Capacity Adding Projects (currently six) • Project Managers to work with SPC and Municipalities to develop Land Use Plans • Design to coordinate with HOP office to encourage developers to utilize smart transportation • District represented on SPC Smart Growth Transportation Work Group
Construction Quality– What’s Important? • Construct on time • Construct within budget • Compliance w/ material standards • Pay contractors promptly • Prompt finalization of contracts • Meet or exceed anticipated life cycle
Construct on Time – What is working? • Monitoring of CPM Schedules • Biweekly Progress Meetings • Following Time Extension Requirements • Discuss With APC at quarterly regional meetings
Construct on Time – Challenges • Utility relocations • Right-of-Way clearances • Design activities monitoring and management on design build projects • Lack of Construction Management Software • Bid package construction schedules
Meet or Exceed Anticipated Life Cycle-What’s Working • Pre pavement and deck pour meetings • Risk based inspection of critical activities • Constructability/Maintainability reviews • Workforce Development – Dep./Consultant • Experience of workforce • Monthly Project Delivery Meetings • Yearly Design/Construct/Maintain workshops • Various ISO processes