Download
1 / 14
140 likes | 243 Views
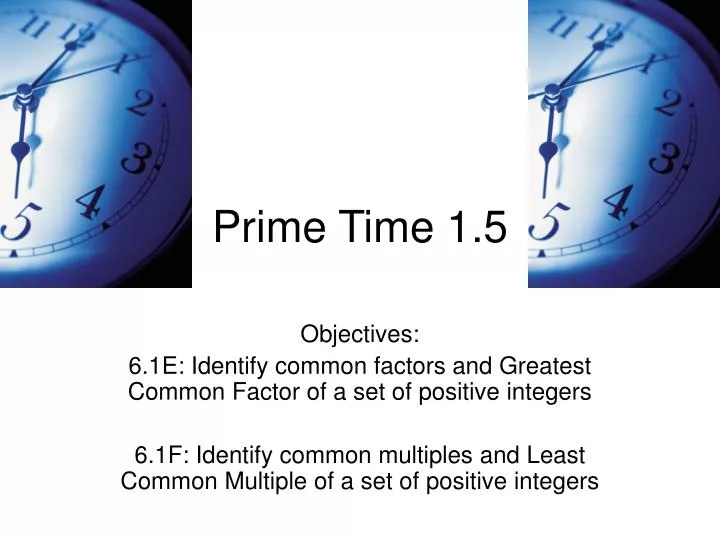
Prime Time 1.5. Objectives: 6.1E: Identify common factors and Greatest Common Factor of a set of positive integers 6.1F: Identify common multiples and Least Common Multiple of a set of positive integers. Venn Diagram. What is a Venn Diagram? What does it look like?

E N D
Prime Time 1.5 Objectives: 6.1E: Identify common factors and Greatest Common Factor of a set of positive integers 6.1F: Identify common multiples and Least Common Multiple of a set of positive integers
Venn Diagram • What is a Venn Diagram? • What does it look like? • How do you use Venn Diagrams?
Definition • Venn Diagram: a diagram in which overlapping circles are used to show relationships among sets of objects that have certain attributes. • This means a Venn Diagram shows what groups have in common and what they don’t!
Example • In a Venn Diagram, group the whole numbers from 1 to 9 according to whether they are prime or multiples of 2. • First, list the numbers that fall into each category: • Prime: • Multiples of 2:
Next, draw and label two overlapping circles, one that represents the prime numbers and one that represents the multiples of 2. Draw a box around them. • Then put each number from 1 to 9 in the appropriate region. • Hints: • The numbers that don’t fall into either category belong outside the circles. • The numbers that are in both categories belong in the overlap of the circles.
Example • Using a T-Chart, list the factors of 30 and 32. • Create a Venn Diagram and fill in all whole numbers less than or equal to 40. Thirty Thirty-two
Questions • 1. What do the numbers in the intersection (the “overlap”) of the circular regions have in common? • 2. List five numbers that fall in the region outside the circles and explain why they belong outside the circles? • 3. What is the biggest number they both have in common?
GCF • The Greatest Common Factor of two numbers is the largest factor the two numbers share! • GCF does not equal KFC. • What is the GCF of 5 and 15? • What is the GCF of 6 and 9?
Example • List the multiples of 5 and the multiples of 2 that are less than or equal to 30. • Fill in a copy of a Venn Diagram with whole numbers less than or equal to 30. Two Five
Questions • What do the numbers in the intersection of the circular regions have in common? • List five more numbers that would be in the intersection if numbers greater than 30 were allowed. • Explain how you can use your completed diagram to find the least multiple that 5 and 2 have in common.
LCM • The Least Common Multiple of two numbers is the smallest multiple two numbers share! • What is the LCM of 5 and 15? • What is the LCM of 6 and 9?
Practice 1) Use a T-chart and a Venn Diagram to organize your information. Find the factors of 24 and 48. What do they have in common? • List the factors of 24: • List the factors of 48: • Fill in the Venn Diagram • What is the GCF? • Circle all prime #s Twenty-four Forty-eight
Practice 2) Use a Venn Diagram to organize your information. List the multiples of 5 and 8. Use all whole numbers, 1-45. • List the multiples of 5 • List the multiples of 8 • Fill in the Venn Diagram • Circle all Prime Numbers • What is the LCM? Five Eight
Review! • What are Venn Diagrams good for? • What is the Greatest Common Factor? • What is the Least Common Multiple? Review! Review Review