Download
1 / 28
280 likes | 413 Views
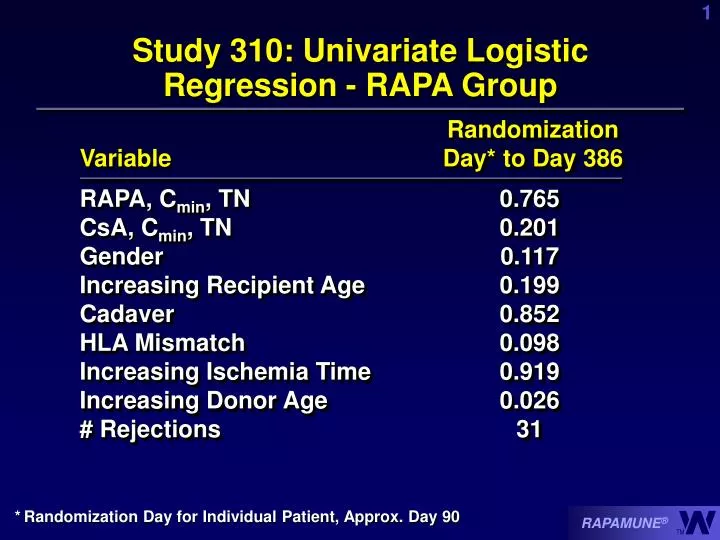
TABLE 8.3E. Study 310: Univariate Logistic Regression - RAPA Group. Randomization Variable Day* to Day 386

E N D
TABLE 8.3E Study 310: Univariate Logistic Regression - RAPA Group RandomizationVariable Day* to Day 386 RAPA, Cmin, TN 0.765CsA, Cmin, TN 0.201Gender 0.117Increasing Recipient Age 0.199Cadaver 0.852HLA Mismatch 0.098Increasing Ischemia Time 0.919Increasing Donor Age 0.026# Rejections 31 * Randomization Day for Individual Patient, Approx. Day 90
3.1A Study 212Enrolled 19.1% Black Patients • Trial 310: 8 patients (1.5%) were black: • RAPA + CsA 5/215 (2.3%) • RAPA 2/215 (0.9%) • Nonrandomized 1/95 (1.1%) • Trial 212: 47 (19.1%) black • RAPA + CsA 18/97 (18.6%) • RAPA 15/100 (15%) • Nonrandomzied 14/49 (28.6%)
Study 212: All 13 Eligible Black Patients Successfully Eliminated CsA • CsA withdrawal arm: • Enrolled 15 • Eligible for CsA taper 13 • 2 patients with AR • Completed CsA taper 13 • 3 patients with AR post CsA withdrawal: 35, 64, and 122 days after completing CsA elimination
Study 212: Similar Rates of Acute Rejection at Months 2 and 12 % N = 18 15 79 85 18 15 79 85 Month 2 Month 12 P = NS
TABLE 3.3.3A Study 212: Significantly Higher Calculated GFR at Month12 in the RAPA Group, Black Patients P = .0003 P = .098 N = 15 13 16 14 15 13
Study 212: Numerically Lower BP in RAPA Group - Black Patients P=0.069 P=0.541 N= 9 7 9 7
Study 212: Patient & Graft Survival (%) By Ethnic Origin: Month 12 RAPA + CsARAPA Fisher’s Exact(N = 97)(N = 100)P value Patient SurvivalBlack17 (94.4) 15 (100) 1.000Non-black 77 (97.5) 81 (95.3) 0.683 Graft SurvivalBlack17 (94.4) 14 (93.3) 1.000Non-black 73 (92.4) 81 (95.3) 0.524
Study 310: No (S.D.) Difference in CADI Score at 1 Year RAPA + CsA RAPA N = 70 N = 56 12 Months Baseline Baseline 12 Months Inflammation Fibrosis Mes Matr Increase Glomerular Sclerosis Tubular Atrophy Intimal Proliferation (VAS) CADI* 0.5 (0.4) 1.1 (0.6) 0.5 (0.4) 0.3 (0.4) 0.64 (0.5) 0.46 (0.48) 3.5 (3.4) 0.03 (0.14) 0.36 (0.5) 0.3 (0.3) 0.3 (0.5) 0.10 (0.3) 0.14 (0.4) 1.2 (1.4) 0.8 (0.6) 1.1 (0.7) 0.5 (0.4) 0.3 (0.5) 0.6 (0.5) 0.37 (0.5) 3.6 (1.9) 0.07 (0.2) 0.33 (0.4) 0.26 (0.3) 0.28 (0.4) 0.07 (0.2) 0.19 (0.3) 1.2 (1.2) *Chronic Allograft Damage Index
Renal Function (Observed Mean)Patients With Biopsy Vs No Biopsy RAPA + CsARAPABiopsy Yes No Yes No N 70 117 P* 56 109 P* Pre-Randomizedcreatinine, µM 142 150ns 155 148 ns 12 Monthcreatinine, µM 150 163 ns 149 138 ns Pre-RandomizedGFR, ml/mn 61 58 ns 56 56 ns 12 monthGFR, ml/mn 59 55 ns 61 64 ns * P: Yes versus No < .05
Study 310: Nonrandomized Patients (Ninety-Five Discontinued Prior to Randomized at Month 3) • Reasons for Discontinuation • 70 (74%) adverse event • 12 (13%) unsatisfactory response, efficacy • 13 (13.6%) other causes
Event Number of Pts. Infection and sepsis 10 Surgical complication 8 HUS 7 Thrombosed artery/vein 6 ATN 5 Hyperlipidemia 5 Thrombocytopenia 5 Study 310Adverse Events Leading to Discontinuation Prior to Randomization at Month 3 Event Number of Pts. Elevated LFTs 4 Pneumonia/pneumopathy 4 Renal dysfunction 4 Cardiovascular 3 CsA toxicity 3 Leukopenia 3 Other 3 HUS = Hemolytic uremic syndrome.ATN = Acute tubular necrosis.LFTs = Liver function tests.
Study 310: 70% of Patients With Acute Rejection Prerandomization – Eventually Randomized • 12 out of 95 (13%) non-randomized patients • 9 mild/moderate acute rejection • 1 severe acute rejection • 1 graft loss • 1 increased creatinine • 70% of patients with acute rejection pre-randomization were eventually randomized
Study 310Nonrandomized Patients: Other causes of discontinuation • Other causes of discontinuation (n=13) • 4 (4 %) patient request • 4 (4%) protocol violation • 3 (3%) other medical event • 2 (2%) protocol stipulations
Renal Function at 12 Months Predicts Long Term Graft Survival 105,743 renal transplant recipients from the UNOS/OPTN database between 1988 and 1998 Creat. 12 Mos Creat. 6 to 12 Mos Graft t1/2 (mg/dL) (mg/dL) (yrs) <1.5 <0.3 11.6 <1.5 >0.3 9.9 >1.5 <0.3 8.9 >1.5 >0.3 6.0 Johnson CP et al. Am J Transplantation, 2001; 1 (Suppl 1): 146.
Study 310: Predicted Long Term Graft Survival Better with RAPA On therapy analysis using the criteria of Johnson CP et al. Am J Transplantation, 2001; 1 (Suppl 1): 146. Creat. 12 Mos Creat. 6 to 12 Mos RAPA+CsA RAPA (mg/dL) (mg/dL) (%) (%) <1.5 <0.3 34.6 60.7 <1.5 >0.3 2.6 0.0 >1.5 <0.3 40.0 28.8 >1.5 >0.3 23.2 10.4 CMH: P = 0.001
Slope of 1000/CreatinineAll Data Between 6 and 24 Months Slope 95% CI of slope P-value* RAPA + CsA –0.013 (–0.017, –0.008) < .001 RAPA 0.008 (0.004, 0.013) < .001 Difference –0.021 (–0.027, –0.014)< .001(RAPA + CsA – RAPA) *Significant P-value indicates non-zero change over time.
Slope of 1000/CreatinineAll Data Between 12 and 24 Months Slope 95% CI of slope P-value* RAPA + CsA –0.015 (–0.021, –0.009) < .001 RAPA 0.003 (–0.004, 0.009) .420 Difference –0.018 (–0.026, –0.009)< .001(RAPA + CsA – RAPA) *Significant P-value indicates non-zero change over time.
TABLE 9.3.2.1C Study 310 Histologic Grade of First Biopsy Confirmed-Acute Rejection by Grade: 12 Months Grade of Nonrandomized Period rejection RAPA + CsARAPA RAPA + CsA P-value* Pre- Mild 12/20 (60.0) 10/22 (45.5) 9/27(33.3)randomization Moderate (2a) 3/20 (15.0) 4/22 (18.2) 7/27 (25.9) Moderate (2b) 4/20 (20.0) 6/22 (27.3) 5/27 (18.5) .336 Severe 1/20 (5.0) 2/22 (9.1) 6/27 (22.2) Post- Mild 5/6 (83.3) 14/21 (66.7) - randomization Moderate (2a) 1/6 (16.7) 6/21 (28.6) - .421 Moderate (2b) - 1/21 (4.8) - Follow up Mild 2/3 (66.7) - 3/7 (42.9) Moderate (2b) 1/3 (33.3) - 2/7 (28.6) - Severe - - 2/7 (28.6) Total Mild 19/29 (65.5) 24/43 (55.8) 12/34 (35.8) Moderate (2a) 4/29 (13.8) 10/43 (16.3) 7/34 (20.6) .514 Moderate (2b) 5/29 (17.2) 7/43 (16.3) 7/34 (20.6) Severe 1/29 (3.4) 2/43 (4.7) 8/34 (23.5) * Between randomized groups
TABLE 9.3.2.1A Study 310: Decreasing Doses of CsA in RAPA Group With Time to First Rejection 30 300 Mean CsA Troughs RAPA RAPA Acute rejection 25 250 RAPA + CsA Acute rejection 20 200 CsA Concentration ng/ml 15 150 % Primary Acute Graft Rejection 10 100 5 50 0 0 0 30 60 90 120 150 180 210 240 270 300 330 360 390 Days Post-transplant
Study 310Thirty-One Patients Discontinued at the3 Month Visit (Days 75-140) • 10 (32%) Adverse event (3 HUS, 2 poor wound healing, 2 hyperlipidemia, 1abdominal LFTs, 1 surgical complication, 1 pain) • 6 (19%) Acute rejection/unsatisfactory response • 5 (16%) Creatinine > 4.5 mg/dL • 5 (16%) Renal dysfunction/dialysis • 3 (10%) Patient non-compliance • 2 (7%) Patient request
TABLE 10.4.2.1.2C Study 310: Lower Mean SerumPotassium (mmol/L) Levels Following Cyclosporine Withdrawal RAPA + CsARAPA ANCOVATime (n = 215)(n = 215)P value Month 1 4.32 0.04 4.34 0.04 - (211) (210) Month 2 4.17 0.04 4.22 0.04 - (208) (197) Month 3 4.13 0.04 4.09 0.04 .158 (186) (191) Month 6 4.11 0.04 3.86 0.03 < .001 (185) (182) Month 9 4.09 0.04 3.82 0.04 < .001 (184) (165) Month 12 4.07 0.04 3.77 0.04 < .001 (185) (163) Month 15 4.09 0.04 3.84 0.04 < .001 (153) (146) Month 18 4.22 0.05 3.98 0.04 < .001 (119) (110) Month 24 4.31 0.14 3.86 0.11 .004 (24) (22)
Study 310: Mean Sirolimus Troughs/Levels and Doses Through 24 Months 8.29 mg 6.05 mg 2.05 mg 2.15 mg
Study 310: Lower Serum Creatinine Following CsA Elimination - Completers Through 24 Months N = 144 N = 143 * P < 0.01
Study 310: PK-PD Analysis Confirms Flexibility of the RAPAMUNE - CsA Combination (Immunoassay)
Studies 207 Plus 210: Lipid Levels vs RAPA Trough Concentrations