Download
1 / 1
10 likes | 50 Views
Analysis of leading and trailing hand forces in spinal cord injury vs. nondisabled subjects during lifting phase. Results show significant differences in reaction forces. Study by Koontz et al. provides insights into custom measurement system for biomechanical evaluation of wheelchair transfers.

E N D
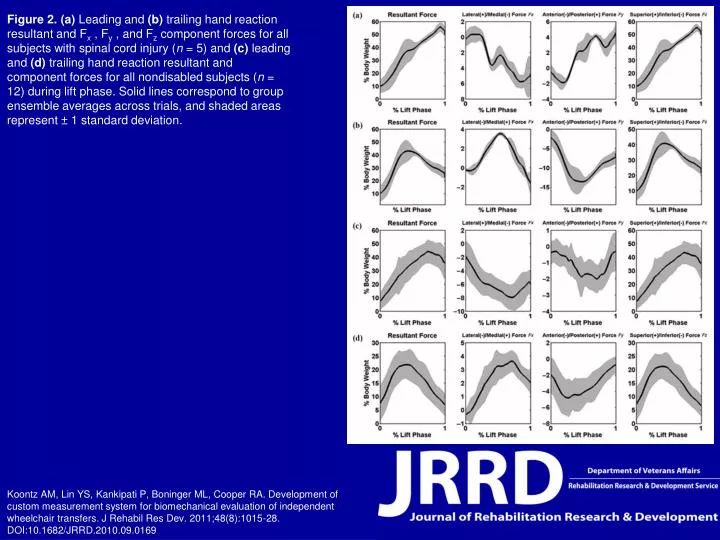
Figure 2. (a) Leading and (b) trailing hand reaction resultant and Fx , Fy , and Fz component forces for all subjects with spinal cord injury (n = 5) and (c) leading and (d) trailing hand reaction resultant and component forces for all nondisabled subjects (n = 12) during lift phase. Solid lines correspond to group ensemble averages across trials, and shaded areas represent ± 1 standard deviation. Koontz AM, Lin YS, Kankipati P, Boninger ML, Cooper RA. Development of custom measurement system for biomechanical evaluation of independent wheelchair transfers. J Rehabil Res Dev. 2011;48(8):1015-28.DOI:10.1682/JRRD.2010.09.0169