Download
1 / 72
720 likes | 822 Views
Benefit-Cost Analysis for Advanced Metering and Time-Based Pricing Final Workshop January 15, 2008. Stephen S. George, Ph.D. Josh L. Bode, M.P.P. Freeman, Sullivan & Co. Michael Wiebe MWConsulting. Workshop Objectives and Agenda. Workshop objective

E N D
Benefit-Cost Analysis for Advanced Metering and Time-Based PricingFinal WorkshopJanuary 15, 2008 Stephen S. George, Ph.D. Josh L. Bode, M.P.P. Freeman, Sullivan & Co. Michael Wiebe MWConsulting
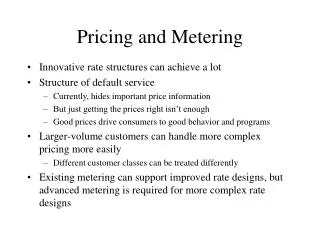
Workshop Objectives and Agenda • Workshop objective • Present the final results of our analysis of the costs and benefits of AMI and time-based pricing in Vermont • Workshop agenda • Methodological summary • Recent developments—Energy Independence & Security Act • Statewide summary • Utility-specific analysis • Rate design issues and policy options • Conclusions and recommendations
The analysis was completed for 10 of Vermont’s 20 utilities • Separately for CVPS, GMP, VEC, BED & WEC • VEC is already installing AMI meters so the analysis only looked at demand response costs and benefits • Jointly for Hardwick, Lyndonville, Stowe, Morrisville and Ludlow • Collectively, these utilities account for 96% of Vermont’s electricity customers and 93% of Vermont’s load
Cost-effectiveness analysis requires examining costs, operational benefits and demand response benefits
The analysis involved three primary work streams • AMI technology selection and cost analysis • Examined the costs associated with multiple technology options, all of which met the minimum requirements of two-way communication and daily delivery of hourly data • Chose the least cost option for each utility • Operational benefit analysis • Examined a limited set of benefits, with avoided meter reading costs being the dominant one • Demand response analysis • Estimated DR benefits (avoided G, T & D capacity and change in energy costs) • Estimated DR costs (marketing and data management)
Key Operational Savings Categories • Avoided meter reading costs • Labor and overheads for meter readers and supervisors • Avoided vehicle and other equipment costs • Savings are offset by severance costs • Field operations • Reduced “no light” calls • Reduced storm restoration costs • Call center • Fewer bill complaints from estimated bills • Reduced meter O&M costs during warranty period • Normal O&M avoided in all future years and counted as a benefit • O&M for new meters is included on the cost side of the ledger with $0 costs during warranty period
The financial benefits associated with DR are estimated as follows Δ Peak Period Energy Use on High Demand Days Market Price of Generation Capacity Generation Performance Factor Generation Capacity Benefits x = x Δ Peak Period Energy Use on High Demand Days T&D Capacity Benefits T&D Performance Factor Marginal Cost of T&D Capacity x = x Wholesale Energy Costs During Off-Peak Period Δ Peak Period Energy Use Wholesale Energy Costs During Peak Period DR Energy Benefits Δ Off-Peak Energy Use x - x =
TRC+ Analysis • Two additional benefit streams were examined but not included in the base case analysis • Environmental benefits • Reliability benefits stemming from reduced outage costs due to reductions in average outage duration • The environmental benefits are quite small because the change in energy use is quite small • 0.87 cents/kWh • The reliability benefits are discussed further on the next two slides
Publicly available data on the impact of AMI on outage duration is limited • Vendor claims are usually for advanced distribution infrastructure systems (ADI), a complement to AMI • Claim outage reduction up to 35% - used as an upper bound for AMI without ADI • Employ a conservative outage reduction (5%) in valuation • Calculate value of avoided costs under multiple scenarios Graph Source: GE’s Advance Distribution Infrastructure Solutions
Avoided outage costs = costs with current average outage durations – costs with reduced outage durations • Used residential and commercial customer damage functions found in • A Framework and Review of Customer Outages (LBNL- 54365) • The study pooled ~30 value of service studies from across the U.S. for a comprehensive study of outage costs • Regression functions allow users to develop customized outage cost estimates • Key inputs include: • Average outage frequency and duration as indicated by the reliability indices provided in response to the DPS data request. • Average annual kWh by customer type • Outage onset • Average residential household income (from VT Indicators Online) • # of employees assumed to be 10 for medium customers and 100 for medium-large customers • Large (>200kW) Industrial customers were excluded since their outage costs vary widely as a function of detailed inputs that were not readily available (e.g., industry type, backup generation, power conditioning equipment, etc)
Recent Developments:Energy Independence and Security Act of 2007
Main Sections Addressing DR, AMI and Smart Grid • Section 529 – National DR Assessment and Action Plan • Section 532 – Additional State Considerations (PURPA Standards) • Section 1301 – Statement of Policy • Section 1302 – Report on Smart Grid Deployments • Section 1303 – Federal Advisory Committee and Task Force • Section 1304 – Technology RD&D • Section 1305 – Interoperability Framework • Section 1306 – Federal Matching Fund • Section 1307 – State Considerations (PURPA Standards) • Section 1309 – Study of Security Attributes
Section 1506 – Matching Grants • New DOE Program to provide reimbursement of 20% of smart grid investments • Procedures published within one year • Authorization of such sums as necessary • Eligible Investments • Manufacture of Efficient Appliances • Modifying special electricity equipment, e.g. motors • Utility installment of Smart Grid-enabled T&D infrastructure • Purchase and installation of metering and control devices and equipment • Software to enable computers to engage in smart grid functions
Section 1307 – State Considerations • Two new “Standards” created under the Public Utilities Regulatory Policy Act (PURPA) • Smart Grid Investments • Utilities must consider smart grid investments before proceeding with “traditional” investments • Utilities are authorized to recover costs of smart grid investments • Utilities are authorized to recover remaining book value of infrastructure made obsolete • Smart Grid Information • Customers shall be provided direct access, in writing or electronically, to information including: • Prices • Usage • Intervals and projections • Sources and emissions
Section 1307 – State Considerations (continued) • Section is built on the “PURPA Construct” • No direct mandate to do • Requirement is to consider • Not just State Commissions • Commence a proceeding or set a hearing date within 1 year • Complete consideration and make determination within 2 years
Preliminary results are based on the following • Mesh is the least cost option for everywhere but WEC, where PLC had the lowest cost • There were typically not large differences in costs across technology options • We assumed that CVPS and GMP would purchase an MDMS system, whereas VEC, BED, WEC and the small utilities would outsource this functionality • Base case is a PTR program with a 75 ¢/kWh adder, 50% awareness rate for residential customers and a 25% awareness rate for commercial customers • VEC analysis only included DR benefits & costs • Present statewide results with and without VEC where appropriate
Without VEC, operational net benefits are negative but overall net benefits are strongly positive—the overall negative is due primarily to GMP
VEC adds about $1.6 million to the overall net benefit estimate
Meter hardware and installation costs account for more than 78% of total costs.
Avoided meter reading costs account for almost 88% of total operational benefits. This share is typically much lower.* *Additional benefits would likely be identified with more detailed analysis
Demand response generates net benefits equal to $24.5 million, with roughly 69% coming from avoided generation capacity costs Includes VEC
DR net benefits vary with input assumptions but remain positive even with significant changes to most key individual input values Includes VEC
DR can reduce average demand on high demand days by 20 MW starting as early as 2011. This estimate is based on only about 55% of load in VT
As is evident below, “the specifics matter.” Costs and benefits vary significantly across companies
Additional benefits in the form of avoided outage costs stemming from reduced outage duration could be substantial. A 5% reduction in outage duration could produce an additional $21.4 million in benefits.
CVPS Characteristics Summary • Roughly 40% of VT electricity sales and 45% of electricity customers • Service territory covers 4,700 sq. mi. • 98 substations • 70,000 transformers, 20% with only one meter • Significantly more meters than customers due to separately metered off-peak water heating • 350,000 calls per year, about 1/3 storm related • Analysis showed that Mesh was the least cost technology option
The CVPS business case is strongly positive, with operational net benefits = $3.1 million and overall net benefits = $13.6 million
Avoided meter reading costs account for more than 90% of total operational benefits* *Additional benefits would likely be identified with more detailed analysis
CVPS’s business case is quite robust across a wide range in key input assumptions • CVPS shows positive net operational benefits • A five-fold increase in marketing costs would still produce positive overall net benefits equal to more than $6 million • A five-fold increase in marketing costs and a 40% reduction in assumed awareness/notification rates would produce roughly a breakeven overall net benefit estimate
GMP Characteristics Summary • Accounts for roughly 1/3 of electricity sales and 1/4 of the customers in VT • 52 substations • 160,000 calls per year, with more than 75% non-storm related • Reads meters every other month and 30% of meters are read using mobile AMR • Meter reading costs are quite low • Mesh was the least cost technology option
GMP’s business case is negative even when DR benefits are included, although additional operational benefits are likely and could create a breakeven business case
Avoided meter reading costs account for almost 75% of total operational benefits* *Additional benefits would likely be identified with more detailed analysis
GMP’s business case is the least robust of all the utilities • Reliability and environmental benefits at GMP would create positive overall benefits equal ~$2.3m • If GMP were to qualify for the 20% Federal grant, overall net benefits would equal ~$1.2m • If default, dynamic pricing was implemented at GMP, overall net benefits could exceed $3m • Implementing AMI and instituting monthly meter reading at GMP would likely generate additional customer and operational benefits
VEC Characteristics Summary • Accounts for about 8% of Vermont electricity sales and about 11% of customers • VEC is already installing AMI meters • Analysis only looked at the incremental costs and benefits associated with time-based pricing • We assumed that MDMS services would be acquired on an outsourcing basis to support time-based billing
The VEC analysis only examined DR benefits & costs, as VEC is already of installing AMI meters.* Net DR benefits equal $1.6m. Reliability benefits would increase this total to $4.2m. *We have assumed that VEC has not included an MDMS in it’s current plans and one would be needed to support DR
BED Characteristics Summary • Accounts for roughly 6% of customers and electricity use • Very compact service territory, only 16 sq. mi. • The commercial sector has a much larger share of load than for the other utilities • 7 substations • Fewer outages than other utilities • Has a high turnover rate given large student population • Examined costs and benefits of remote connect/disconnect under partial and full deployment scenarios • Benefits exceeded costs for the partial deployment scenario • Mesh proved to be the least cost technology
The BED business case shows a small negative value for operational net benefits but is positive when DR is included. Reliability benefits would add an additional $440k.
Partial deployment of remote disconnect functionality improves BED’s business case and accounts for almost 1/3 of operational benefits
WEC Characteristics Summary • Accounts for only about 3% of Vermont’s customers and 1% of Vermont’s electricity use • Roughly 10,000 customers, nearly all of which are residential accounts • 8 substations • 1,200 sq. mi. service territory with very low customer density • Meter reading operation is contracted out • PLC proved to be the least cost technology
WEC’s business case shows positive operational net benefits and overall net benefits of $1.2m when DR is included. Reliability would add $0.3m
Avoided meter readings costs account for 75% of total operational benefits. Avoided meter reading benefits of $1.95m alone exceed AMI costs of $1.85m