Download
1 / 58
580 likes | 732 Views
CBRFC Forecast Products: Where, When, and What is Issued?. CBRFC Fourth Annual Stakeholder Forum February 25 th – 26 th , 2014 Salt Lake City, Utah. NOAA’s National Weather Service Colorado Basin River Forecast Center. NOAA’s National Weather Service. Overview. Daily Model Accessing

E N D
CBRFC Forecast Products:Where, When, and What is Issued? CBRFC Fourth Annual Stakeholder Forum February 25th– 26th, 2014 Salt Lake City, Utah NOAA’s National Weather Service Colorado Basin River Forecast Center NOAA’s National Weather Service
Overview • Daily Model • Accessing • Interpretation • Daily ESP • Seasonal Water Supply Forecasts • Peak Flow Forecasts • Discussion
Overview Increasing Stakeholder Reach Increasing Stakeholder Engagement
What you should take away… • We incorporate information from a variety of sources to come up with our forecasts, which are distributed at various intervals throughout the month during the year. • ESP is becoming our primary forecasting tool for water supply. • Our products can evolve to meet your needs, so let us know!
Part 1: Daily Model
Daily Model • Deterministic forecast that is updated at least once daily, though more frequently during times of hydrologic significance • Coupled, lumped, hydrologic model within the Community Hydrologic Prediction System (CHPS) • Sacramento Soil Moisture Accounting (SAC-SMA) • SNOW-17 (Temperature-indexed snow accumulation/melt model) • Dependent on observed temperature, precipitation, freezing level, and reservoir data
BIG COTTONWOOD CK - SALT LAKE CITY, NR BCTU1 925 430 798 176 05/16/14 5/18 - 6/7 Daily Model • The results of this model output are ultimately what is available through the CBRFC website Click here to start web demonstration
See areas of hydrologic interest Conveniently zoom to a selected area of interest Options to customized your map I’ve added SNOTEL sensors in the Lake Powell region
Observed Data Forecasted Data Options to customize the hydrograph
CBRFC forecasts and supporting data are available through the CBRFC website. Forecasts are plotted together with historical exceedance probabilities derived from the USGS gage record. CBRFC incorporates 10 days of forecasted temperature data and 5 days of forecasted precipitation data into these forecasts. These are REGULATED values. Because of their dependence on weather forecasts which become less certain with increasing lead time, CBRFC streamflow forecasts also become less certain with increasing lead time. Forecasts are usually available by 10:00 a.m. every day. Daily Model
So…. • What does Daily forecasting tell us? • It gives us a forecast of instantaneous flow at defined model points using current hydrologic conditions, along with 5 days of precipitation and 10 days of temperature forecasts. Any information we have regarding regulation and diversions is also included. • When does it tell us? • Every day at least, more frequently during times of hydrologic interest.
Part 2: Daily ESP Forecast
Daily ESP Forecast • Ensemble Streamflow Prediction • Run daily with updated initial conditions • Uses historical temperature and precipitation (currently using 30 traces from 1981-2010) • Four separate runs are produced • Unregulated with 5 days QPF • Unregulated without QPF • Regulated with 5 days QPF • Regulated without QPF
Daily ESP Forecast With 5-day QPF Without 5-day QPF Click here to start web demonstration
Daily ESP Forecast • The daily ESP forecast period changes depending on whether or not we are in the forecast period • For example, in the Upper Colorado River Basin, we forecast for the April through July runoff volume • After April 1st, we forecast from the current day through July • It is important to account for the observed volume when we are in the forecast period
Daily ESP Forecast Without observations, our forecast is not as intuitive.
Daily ESP Forecast Residual period needs to take into account observed volume within the forecast period
Daily ESP Forecast *Seasonal forecast for LCLA3 is January through June.
So…. • What does our daily ESP water supply forecasts tell us? • They give us a forecast of (usually) April – July unregulated volume at specific forecast points. They give us an idea of the trend the forecasts are taking in response to current conditions. • When does it tell us? • Every day, shortly after the beginning of the water year, through July.
Part 3: Seasonal Water Supply Forecasts
Seasonal Water Supply Forecasts • Water supply forecasts are issued monthly by the CBRFC, near the beginning of each month. • Forecasters rely on a combination of guidance from an analysis of ESP output, Statistical Water Supply (SWS) output, and expertise to develop water supply products • Water Supply Forecasts are typically UNREGULATED flow volume forecasts. • In the Upper Colorado River and Great Basins, forecasts are for the April through July season. In the Lower Colorado River Basin, forecasts are for the January through May season.
Seasonal Water Supply Forecasts • On a day to day basis, ESP is approved by a forecaster; however, a detailed examination of model states and conditions is not done. • “Jumps” in daily ESP could be due to a number of factors. • Recent storm activity • Update to model states (e.g., snow, soil moisture, etc…)
So…. • What do water supply forecasts tell us? • They give us a seasonal forecast of (usually) unregulated inflow volume at specific forecast points. They are based on guidance from SWS and ESP tools, as well as forecaster expertise. • When does it tell us? • Typically monthly. April – July forecasts are typically available from January through July.
Part 5: Peak Flow Forecasts
Peak Flow Forecasts • The CBRFC generates peak flow forecasts throughout the snowmelt runoff season, as needed from March to end of runoff season • Represents mean daily peak flow during the April – July runoff period • Presented in terms of exceedance probabilities • Developed using ESP • Most applicable to headwater basins, for recreationalist, flood control, and wildlife managers
Peak Flow Forecasts • Probabilistic forecast • Issued monthly • 10%, 25%, 50%, 75%, 90% exceedance probabilities • Approximately 80 points • Accounts for diversions and reservoir regulation, similar to daily forecasts
Spring Weather Really Matters • Runoff characteristics are largely determined by the day-to-day spring weather. • While large snow pack years increase chances for flooding, it is not an inevitability (dodged a bullet at many sites in 2011) • Small snow pack years can flood with the right sequence of spring temperatures and with flows enhanced by precipitation. • Rain events may play a larger role in the magnitude of the peak flow during very low snow years. • Keep an eye on our web page / daily forecasts
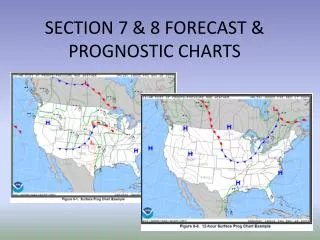
This is our old peak flow map. We’re hoping to have something similar for this season.
Previous years show probabilistic distribution of peak flows.
When a peak nears occurrence, DO NOT use the peak flow list. Instead, look at the daily hydrograph.
Accounting for diurnal variationdaily mean to instantaneous peak adjustment • some rivers have predictable diurnal melt variations • instantaneous peak exceeds daily mean • RFC ESP forecasts simulate the daily mean (from 6 hr models) • we now use theobserved relationship between daily mean and instantaneous peak to relate our daily mean peak forecast percentiles to instantaneous peaks
So…. • What do peak flow forecasts tell us? • They tell us the highest expected daily mean flow value during the spring runoff period. • When does it tell us? • Monthly (or more as needed), between March and the end of the runoff period.
Some thoughts… • Do you access the daily ESP graphics on the CBRFC website? Are they informative? • How do you receive CBRFC forecasts? How do you want to receive them? • Is the difference clear between what drives the short term deterministic vs. the long range probabilistic forecasts?
Daily Model The Gunnison River Basin is divided into lumped catchments. Flow is typically routed from one catchment to downstream catchments. The furthest downstream catchment in the Gunnison is highlighted here.
Daily Model As shown in this stick diagram, headwater catchments flow into downstream catchments, which, in turn, contribute to flow further downstream.
Daily Model Each catchment is separated into 1 to 3 zones, depending on catchment size and topographic variability. Here, an upper (gray), middle (brown), and lower (green) zone are apparent.
Daily Model As an example, the Gunnison River Basin is shown here.
Daily Model Forecasters adjust SAC-SMA and SNOW-17 input parameters within the CHPS framework in an effort to produce the most accurate forecast possible.
ESP Forecast Traces • ESP Forecast Traces are not equivalent to Daily ESP output. The traces are adjusted • It is important to note that the adjustment is solely done for the benefit of stakeholders in their modeling efforts • Allows Reclamation to compare 24 Month Study to MTOM output more directly • Adjustment factors are not representative of an ESP bias or error • Adjustment is done more for numerical or statistical purposes than for physical reasons
This Water Supply Approval Tool allows forecasters to compare output from SWS and ESP, historical flow volumes, and compare spatial differences between basins before publication.
Monthly and Seasonal Water Supply Forecasts Daily ESP forecasts provide an assessment of streamflow conditions, and typically indicates whether official forecasts are expected to rise or fall.
Seasonal Water Supply Forecasts • Unregulated Reservoir Inflow Forecasts issued approximately biweekly • 3-Month Outlook, with Apr-Jul provided beginning in January • Precipitation summary provided as well
Part 4: ESP Forecast Traces
ESP Forecast Traces • 32-Month ESP traces have been generated for use by stakeholders in the development of probabilistic, operational resource-management models • Traces are adjusted such that the median of the traces is equivalent to the final forecast issued • This adjustment is applied so that the ensemble is comparable to the final forecast
ESP Forecast Traces Note differences between RFC forecast (blue triangles) with median forecast derived from ensemble of 30 traces.