Download

1 / 60
600 likes | 766 Views
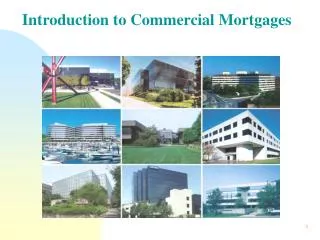
Introduction to Commercial Mortgages. Commercial Mortgages. A commercial mortgage is a mortgage (note+mortgage) where the collateral that is pledged is an income-producing commercial property Major types Multifamily Office Retail Hotel Industrial/Warehouse. 280 Trumbull Hartford.

E N D
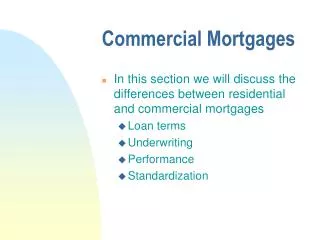
Commercial Mortgages • A commercial mortgage is a mortgage (note+mortgage) where the collateral that is pledged is an income-producing commercial property • Major types • Multifamily • Office • Retail • Hotel • Industrial/Warehouse
280 Trumbull Hartford 57 Dodge New Haven
Unlike housing, commercial real estate markets have been “holding up” somewhat better than housing but there are “cracks” appearing Source: September Release – Beige Book
Commercial Properties • Each type of commercial property represents a unique business with its own unique risks and returns • We will focus on a common attribute: • that for each type of property, the fee simple owner of the property generates income by leasing the real estate to a user in return for periodic lease payments. • Local supply & demand determine prices (rents) • When demand falls, you can’t move the property– supply is fixed • When demand increases, supply can only respond with a lag • National markets determine many of the operating costs
Income Statements • The income statement for a commercial property has the following general format: Potential Gross Income (PGI) -Vacancy Effective Gross Income (EGI) -Operating Expenses Net Operating Income (NOI)
NOI • Income +$228,026 • Expenses - $65,690 • NOI $162,336
The Net Operating Income(NOI) from a commercial property is a measure of the property’s income generating capability and hence the owner’s capacity to service debt. • There are many different strategies for getting to NOI, but the bottom line is measured by NOI • NOI is often used to get a rough estimate of the value of a commercial property • Cap rates:
So are Vacancy Rates—except for uptick at end Is this a trend or a blip?
Source: Coldwell Banker Report on Commercial Real Estate Fall 2008
Commercial Mortgages Our focus today will be on the Differencesbetween residential and commercial mortgages Loan terms Underwriting Performance Standardization
Commercial Mortgage Originations • Good Origination Data for Commercial Mortgages is Hard to Get • MBA Surveys Members • Coverage is approximately 50% • Total Origination Volume: Approximately $300-$400 Billion/year • Turnover outstanding stock in 7-10 years • Plus growth • MBA Surveys Sell Lists of Top Originators
Commercial Mortgage Originations: Pricing • Commercial Mortgages Priced off the Ten Year Treasury • Basically BBB credit • Spreads: • Typical Range from 100-250 over 10 year Treasury • Long Run Average about 150 bp for “best” loans • Current averages 250-300bp • Still about 150bp for “premier” loans
Underwriting Commercial Loans • “Three C’s” still generally apply • Capacity measured by DSCR • ratio of NOI to required debt service • Higher numbers (>1)indicate greater cushion • Collateral measured by LTV ratio • Appraised value generally based on income approach to valuation • Present value of future income • Credit measured by track record of owner/manager/developer • Current and past operating results
Current Ratios • DSCR: Realty Rates average about 1.4 • Range for major types: ~1.40 • Hotels ~1.6 • Minimums reflect special situations • LTV: Realty Rates Average: < 75% • Range for major types: 70-74% • Hotels ~68 • Term: Payment calculated based on Amortization period, loan due at end of Term • Term: with exception of apts. term≤10 years • Amortization Period: roughly 25 years
Personal Research Data • Conduit loans originated in 1997 and 1998 • Tracked and observed until 2003 • property type Freq. Percent Cum. • ------------+----------------------------------- • office | 1786 13.48 13.48 • hotel | 1122 8.47 21.96 • multifamily | 4824 36.42 58.38 • retail | 3951 29.83 88.21 • industrial | 1562 11.79 100.00 • ------------+----------------------------------- • Total | 13245 100.00
LTV by Property Type Summary of Cut-off date LTV ratio Property type Mean Std. Dev. Freq. ------------+------------------------------------ office | .68 .09 1786 hotel | .66 .10 1122 multifamily| .72 .09 4824 retail | .71 .10 3951 industrial | .68 .11 1562 ------------ +------------------------------------ Total | .70 .10 13245
DSCR by Property Type Property type | Summary of Cut-off date DSCR | Mean Std. Dev. Freq. ------------+------------------------------------ office | 1.46 .29 1786 hotel | 1.61 .30 1122 multifamily| 1.44 .25 4824 retail | 1.40 .27 3951 industrial | 1.51 .37 1562 ------------+------------------------------------ Total | 1.45 .29 13245
Performance • Commercial Loans are generally viewed as having more credit risk and less prepayment risk than residential mortgages • More “ruthless” exercise of the option to default • Generally no effective recourse to other assets of borrower • Frequently the borrower is a special purpose corporation
Overall Average for Commercial Mortgages: 12%-15% Overall Average for Residential Mortgages: 1% -3% Source: ACLI data
Default Experience through 2003 for Loans Originated in 1997-1998 Property type | % Defaulted Mean # of Defaults Total ------------+------------------------------------ office | .026 46 1786 hotel | .156 175 1122 multifamily| .021 101 4824 retail | .043 169 3951 industrial | .020 31 1562 ------------+------------------------------------ Total | .039 522 13245
Prepay Experience through 2003 property type| % Prepaid | Mean # Prepaid Total ------------+------------------------------------ office | .025 45 1786 hotel | .012 13 1122 multifamily| .043 207 4824 retail | .015 59 3951 industrial | .025 39 1562 ------------+------------------------------------ Total | .027 363 13245
LTV & Default Risk Residential Loans • Source: Avery Bostic Canner & Calem (Federal Reserve Bulletin) Table 1 • Default Rates for Residential Loans by LTV Category
Debt Service Coverage Exhibits Little Systematic Relationship with Default