Download
1 / 37
370 likes | 509 Views
NetMine: Mining Tools for Large Graphs. Deepayan Chakrabarti Yiping Zhan Daniel Blandford Christos Faloutsos Guy Blelloch. Introduction. Protein Interactions [genomebiology.com]. Internet Map [lumeta.com]. Food Web [Martinez ’91]. ► Graphs are ubiquitous. Friendship Network [Moody ’01].

E N D
NetMine: Mining Tools for Large Graphs Deepayan Chakrabarti Yiping Zhan Daniel Blandford Christos Faloutsos Guy Blelloch
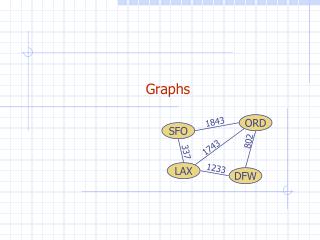
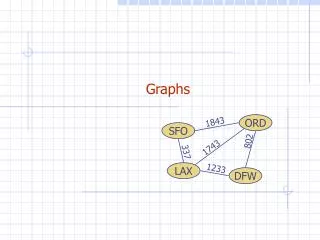
Introduction Protein Interactions [genomebiology.com] Internet Map [lumeta.com] Food Web [Martinez ’91] ► Graphs are ubiquitous Friendship Network [Moody ’01]
Count vs Outdegree Graph “Patterns” • How does a real-world graph look like? • Patterns/“Laws” • Degree distributions/power-laws Power Laws
Effective Diameter Hop-plot Graph “Patterns” • How does a real-world graph look like? • Patterns/“Laws” • Degree distributions/power-laws • “Small-world” • “Scree” plots • and others…
Graph “Patterns” • Why do we like them? • They capture interesting properties of graphs. • They provide “condensed information” about the graph. • They are needed to build/test realistic graph generators (useful for • simulation studies • extrapolations/sampling ) • They help detect abnormalities and outliers.
Graph Patterns • Degree-distributions “power laws” • “Small-world” small diameter • “Scree” plots • … • What else?
Our Work The NetMine toolkit contains all the patterns mentioned before, and adds: • The “min-cut” plot • a novel pattern which carries interesting information about the graph. • A-plots • a tool to quickly find suspicious subgraphs/nodes.
Outline • Problem definition • “Min-cut” plots ( +experiments) • A-plots ( +experiments) • Conclusions
“Min-cut” plot • What is a min-cut? Minimizes the number of edges cut Size of mincut = 2 Two partitions of almost equal size
“Min-cut” plot • Do min-cuts recursively. log (mincut-size / #edges) Mincut size = sqrt(N) log (# edges) N nodes
“Min-cut” plot • Do min-cuts recursively. New min-cut log (mincut-size / #edges) log (# edges) N nodes
“Min-cut” plot • Do min-cuts recursively. New min-cut log (mincut-size / #edges) Slope = -0.5 log (# edges) For a d-dimensional grid, the slope is -1/d N nodes
“Min-cut” plot log (mincut-size / #edges) log (mincut-size / #edges) Slope = -1/d log (# edges) log (# edges) For a random graph, the slope is 0 For a d-dimensional grid, the slope is -1/d
“Min-cut” plot • Min-cut sizes have important effects on graph properties, such as • efficiency of divide-and-conquer algorithms • compact graph representation • difference of the graph from well-known graph types • for example, slope = 0 for a random graph
“Min-cut” plot • What does it look like for a real-world graph? log (mincut-size / #edges) ? log (# edges)
Experiments • Datasets: • Google Web Graph: 916,428 nodes and 5,105,039 edges • Lucent Router Graph: Undirected graph of network routers from www.isi.edu/scan/mercator/maps.html; 112,969 nodes and 181,639 edges • User Website Clickstream Graph: 222,704 nodes and 952,580 edges
Experiments • Used the METIS algorithm [Karypis, Kumar, 1995] • Google Web graph • Values along the y-axis are averaged • We observe a “lip” for large edges • Slope of -0.4, corresponds to a 2.5-dimensional grid! Slope~ -0.4 log (mincut-size / #edges) log (# edges)
Experiments • Same results for other graphs too… Slope~ -0.57 Slope~ -0.45 log (mincut-size / #edges) log (mincut-size / #edges) log (# edges) log (# edges) Lucent Router graph Clickstream graph
Observations • Linear slope for some range of values • “Lip” for high #edges • Far from random graphs (because slope ≠ 0)
Outline • Problem definition • “Min-cut” plots ( +experiments) • A-plots ( +experiments) • Conclusions
A-plots • How can we find abnormal nodes or subgraphs? • Visualization • but most graph visualization techniques do not scale to large graphs!
A-plots • However, humans are pretty good at “eyeballing” data • Our idea: • Sort the adjacency matrix in novel ways • and plot the matrix • so that patterns become visible to the user • We will demonstrate this on the SCAN+Lucent Router graph (284,805 nodes and 898,492 edges)
A-plots • Three types of such plots for undirected graphs… • RV-RV (RankValue vs RankValue) Sort nodes based on their “network value” (~first eigenvector) Rank of Network Value Rank of Network Value
A-plots • Three types of such plots for undirected graphs… • RD-RD (RankDegree vs RankDegree) Sort nodes based on their degree Rank of Degree of node Rank of Degree of node
A-plots • Three types of such plots for undirected graphs… • D-RV (Degree vs RankValue) Sort nodes according to “network value”, and show their corresponding degree
RV-RV plot (RankValue vs RankValue) • We can see a “teardrop” shape • and also some blank “stripes” • and a strong diagonal • (even though there are no self-loops)! Stripes Rank of Network Value Rank of Network Value
1 2 RV-RV plot (RankValue vs RankValue) • The “teardrop” structure can be explained by degree-1 and degree-2 nodes Rank of Network Value NV1 = 1/λ * NV2 Rank of Network Value
RV-RV plot (RankValue vs RankValue) • Strong diagonal nodes are more likely to connect to “similar” nodes Rank of Network Value Rank of Network Value
RD-RD (RankDegree vs RankDegree) • Isolated dots due to 2-node isolated components Rank of Degree of node Rank of Degree of node
D-RV (Degree vs RankValue) Degree Rank of Network Value
D-RV (Degree vs RankValue) Why? Degree Rank of Network Value
Explanation of “Spikes” and “Stripes” • RV-RV plot had stripes; D-RV plot shows spikes. Why? “Stripe” nodes degree-2 nodes connecting only to the “Spike” nodes “Spike” nodes high degree, but all edges to “Stripe” nodes Stripe
A-plots • They helped us detect a buried abnormal subgraph • in a large real-world dataset • which can then be taken to the domain experts.
Outline • Problem definition • “Min-cut” plots ( +experiments) • A-plots ( +experiments) • Conclusions
Conclusions • We presented • “Min-cut” plot • A novel graph pattern • with relevance for many algorithms and applications • A-plots • which help us find interesting abnormalities • All the methods are scalable • Their usage was demonstrated on large real-world graph datasets
RV-RV plot (RankValue vs RankValue) • We can see a “teardrop” shape • and also some blank “stripes” • and a strong diagonal. Rank of Network Value Rank of Network Value
RD-RD (RankDegree vs RankDegree) • Isolated dots due to 2-node isolated components Rank of Degree of node Rank of Degree of node