Download
1 / 22
220 likes | 460 Views
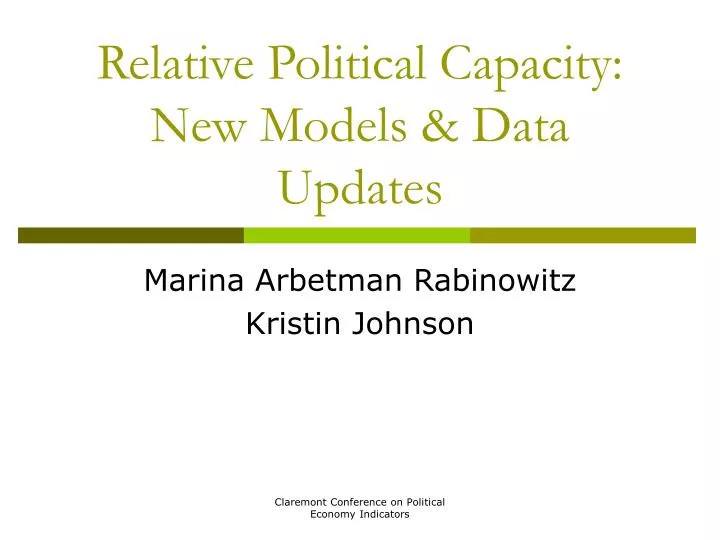
Relative Political Capacity: New Models & Data Updates. Marina Arbetman Rabinowitz Kristin Johnson. Indicators of Political Development. Indicators of Well being :

E N D
Relative Political Capacity: New Models & Data Updates Marina Arbetman Rabinowitz Kristin Johnson Claremont Conference on Political Economy Indicators
Indicators of Political Development • Indicators of Well being: Electricity, calories per capita, education, health, etc. Deutsch (1966), Rokkan (1970), Gurr (1974), World Handbook of Social Indicators (WB), Human Development Index (UN), Millennium Development Goals. • Democracy Research: Participation, representation, electoral choice, institutions, bureaucracy (Campbell, Converse, Stokes and Miller, 1960; Verba, Nie and Petrocik, 1972; and Fiorina, 1981). Freedom House Index, Polity IV (democracy/ autocracy), Governance Indicators. Claremont Conference on Political Economy Indicators
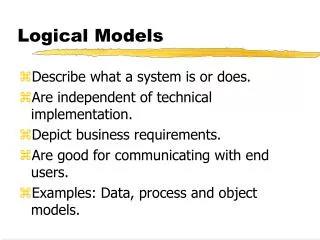
Theoretical issues These approaches each fall into the trap of measuring the consequences or reflecting phenomena other than capabilities but have the advantage of measuring the phenomena directly. • Measures of well being reflect government and elite choice in resource allocation • Measures of governance favor democratic systems of government over other forms of governance. Claremont Conference on Political Economy Indicators
Relative Political Capacity Measures the discretionary power of the government to implement a desired policy. The Relative Political Capacity of a government is the ratio of revenues a government extracts, compared to predicted levels a society could attain based on economic endowment. RPC = Actual Government Revenue Predicted Government Revenue Claremont Conference on Political Economy Indicators
Predicted RATIO OF Performance REVENUE Boundary of High TO GDP Performance Successful States Fragile States Boundary of Low Performance Poor Developing Developed Relative Political Capacity Claremont Conference on Political Economy Indicators
Examples: RPC across time Bolivia High RPC Thailand Botswana Angola 1960 1980 1960 2000 1970 1980 1990 2005 1990 1970 2000 2005 1990 1990 1970 2000 1960 1970 1980 2005 1980 2000 Low RPC 2005 2000 4000 6000 8000 0 GDP per Capita Claremont Conference on Political Economy Indicators
Lesotho Brazil Hungary Israel Sweden positive Portugal Burkina Faso Austria Barbados Tunisia Poland Ecuador New Zealand Denmark Uruguay Kenya Finland Morocco Malta Greece Singapore Papua New Guinea USA RPC 0 Indonesia South Korea Jordan Fiji Malaysia Sri Lanka Thailand Bolivia Philippines Mauritius Iran Argentina Kuwait Gabon Bangladesh negative Paraguay Haiti Myanmar 0 40,000 Income RPC 2000 Claremont Conference on Political Economy Indicators
RPE General Model Yit = α + β Xit + Vr Yit = Adjusted tax revenue for country i at time t X it = Vector of variables that determine potential tax collection Vr= White noise disturbance Claremont Conference on Political Economy Indicators
Inter country comparisons:Models for Developing Societies Model 1: Tax/Gdp= α + β1 time - β2 min/gdp + β3 gdpCap + β4 exports/gdp + β5 Oil + ξ Tax= (TaxRev-NonTax-SocSec)/Gdp RPC1 = Real /Predicted Note: Control for expenditures Model 2: Tax/Gdp= α + β1 time - β2 min/Gdp + β3 agr/Gdp + β4 exports/Gdp + β5 Oil + ξ Tax= (TaxRev-NonTax-SocSec)/Gdp RPC2 = Real /Predicted Claremont Conference on Political Economy Indicators
Inter country comparisons:Models for Developed Societies Model 3: Tax/Gdp= α + β1 time - β2 min/gdp + β3 gdpCap + β4 Exports/gdp + β5 health/gdp + ξ Tax= (TaxRev-NonTax-SocSec)/Gdp RPC3 = Real /Predicted Claremont Conference on Political Economy Indicators
Empirical Inventory • National Level model • Unit of analysis: country • Number of countries in the sample: 129 • Time span: 1960-2005 • Notes: Sample includes Poland 86-on, Hungary 89-on, Romania 88 on. These countries use NMP in their National Accounts before those dates so the data is not comparable to GNP/GDP methodology). The sample includes China. Claremont Conference on Political Economy Indicators
Variables & Sources Claremont Conference on Political Economy Indicators
Data Collection Issues • Data relies on national government accounts • Variances in tax reporting and accounting are noted by IMF or WB, in most cases. • Currency changes and differences in reporting timing in high inflation situations need to be normalized. • National sources may be necessary to supplement Claremont Conference on Political Economy Indicators
Measurement & Conceptualization • Health expenditures: before 1990s mostly government reported public expenditures, now private are part of the mix in both developed and developing but not always reported • Social Security: 1) some countries have privatized part of SS. 2) The argument to exclude social security has been that those transfers have been allocated previous to the collection and therefore there is little room for any further manipulation by the government. This is not the case, those funds are not untouchable, and the deficit can be manipulated by Central Banks or Congress • Agriculture: Still our best empirical fit for developing countries (not for developed) but 1960s is the anchor so we need to control for time. • Taxation: Indirect vs. direct taxation Claremont Conference on Political Economy Indicators
Sub National Models Yit = α + β Xit + Vr Yit = Adjusted tax revenue for country i at time t X it = Vector of variables that determine potential tax collection Vr= White noise disturbance • Conceptually, the same model as national level. • Constraints to choosing the variables are country specific Claremont Conference on Political Economy Indicators
Relative Provincial Political Capacity (RPPC) Model 1: Transf/gdp = α + β1 time + β2 min/gdp + β3 agr/gdp + β4 rev/gdp + ξ Model 2: Transf/gdp= α + β1 time + β2 gdpCap+ β3 rev/gdp+ β4 min/gdp + ξ Model 3: Rev/gdp= α + β1 time + β2 transf/gdp+ β3 agr/gdp + β4 min/gdp + + β5 Subsidies+ ξ Claremont Conference on Political Economy Indicators
Empirical Inventory • Sub National Level Model • Unit of analysis: province/state/region • Time span:Ideally 1990 – 2005, dependant on individual country • Bolivia, Brazil, China, EU, India, Indonesia, Iran, Mexico, Nigeria, Thailand, Sudan, USA, Claremont Conference on Political Economy Indicators
Data Collection • In many countries the transfers are decided according to a Congressional Allocation Funds formula. If the allocations are decided on annual negotiations (1), the variable captures the concept of RPPC. If the formula is inflexible (2), the flexibility comes from the allocation of central government expenditures to the provinces. • It is also important to know that the General Appropriation Act does not show if or how much of the money is released, so instead of following to entry number (Transfers, Subsidies. Models 1& 3) in some cases is better to look at the exit number (Expenditures. Model 2) Claremont Conference on Political Economy Indicators
Variables: RPPC Claremont Conference on Political Economy Indicators
Sources Examples: RPPC Claremont Conference on Political Economy Indicators
Applications • International Conflict • Organski & Kugler 1980; Lemke 1996; Tammen et al 2002. • Internal Conflict • Kugler et al 1997; Benson & Kugler 1998; Johnson 2007. • Demographic Transitions • Arbetman, Kugler & Organski 1980, 1994, 1999; Feng Kugler & Zak 2000, 2007. • Economic Applications • Exchange Rates: Arbetman 1990; Growth: Leblang 1997; Inflation: Alcazar 1997; Private Investment: Feng & Chen 1997, Feng 2004; Policy Implementation: Snider 1997; Informal Markets: Arbetman 1990, 1994; Arbetman & Ghosh 1997. • Sub National • Rouyer 1997; Swaminanthan 2005; 2007; Johnson 2007. Claremont Conference on Political Economy Indicators
+ Very High High Average Predicted Performance Low Very Low _ Poor Developing Developed Relative Political Capacity RPC at different levels of development Claremont Conference on Political Economy Indicators