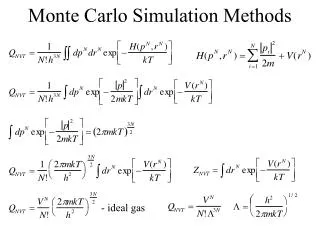
Download
1 / 26
290 likes | 596 Views
Monte Carlo Simulation. Analytica User Group Modeling Uncertainty Series #3 13 May 2010 Lonnie Chrisman, Ph.D. Lumina Decision Systems. Course Syllabus (tentative). Over the coming weeks: What is uncertainty? Probability. Probability Distributions Monte Carlo Sampling (today)

E N D
Monte Carlo Simulation Analytica User Group Modeling Uncertainty Series #3 13 May 2010 Lonnie Chrisman, Ph.D. Lumina Decision Systems
Course Syllabus(tentative) Over the coming weeks: • What is uncertainty? Probability. • Probability Distributions • Monte Carlo Sampling (today) • Measures of Risk and Utility • Common parametric distributions • Assessment of Uncertainty • Risk analysis for portfolios • (risk management) • Hypothesis testing
Today’s Outline • LogNormal exercise (review) • Another way to represent uncertainty • The representative sample • Computing result uncertainty • The Run index and Sample(..) • Sample error • Latin Hypercube • Viewing uncertainty • Evaluation modes
Modeling Exercise A mining company obtains rights to extract a gold deposit during a one-week window next year, before a construction project starts on the site. Extracting the deposit will cost $900K. The size of the deposit: LogNormal(Mean:1K,Stddev:300) oz. The price of gold next year: LogNormal(Mean:$1K, stddev:$500) What is the expected value of these mining rights? Compare to result ignoring uncertainty. Hint: The price of gold next year becomes known before the decision to proceed with extraction.
Another representation of Uncertainty:A Representative Sample • 10 possible prices for gold next year (in $ per oz): $411/oz $548 $650 $746 $843 $949 $1,073 $1,230 $1,459 $1,945 ~$100/oz spacing This “sample” is a way to representour uncertainty about the quantity. It captures the range of possibilities. ~$500/ozspacing
How uncertain is a computed result? { The model’s result } • Profit := f(Price) • Compute each “scenario” separately. • The result is a representative sample for Profit. • This sample becomes our representation for the uncertainty in the result. • This method works when computing any function!
Multiple Uncertain Inputs Oops: The computed results here are not representative. Why? • bad Each line hereis a separate“scenario”. Mean(profit)=394K
Multiple Uncertain Inputs • bad Each line hereis a separate“scenario”. Shuffle eachsample separately. (They are independent) Mean(profit)=232K
Analytica’s Internal representation of Uncertainty • bad Run index Analytica represents (and computes) uncertainty using samples indexed by Run. Mean(profit)=231K
Analytica Generates the Sample for you Leak rate Definition: LogNormal(mean:10K,stddev:8K) Sample(Leak_rate): Array(Run,[3.5K,18.3K,12.1K,…]) • We usually encode uncertainty assessments using distribution functions (for convenience). • Analytica generates sample from the distribution and uses these for computations. • We can, however, supply the sample directly if we want (e.g., if we have measurements).
Exercise • Try this in Analytica: Mean( Normal(0,1) * Normal(0,1) ) • Is the computed result correct? Why not? • (use SampleSize=100) • Theoretical answer = 0.0 • Computed result: e.g., 0.083 • (your result will vary, due to randomness in sample generation)
Sample Error • A sample is an approximate representation of the analytic distribution. • Computations based on the this sample end up with some error as a result of the approximation. • This error is called “Sample Error”. • Sample error reduces with larger sample size.
Sample Error:Precision of computed mean • You compute the mean for an uncertain result. • You want to be 95% sure that: • Guaranteed when: Where σ =SDeviation(y) is estimated first by using a small sample. Notice: Reference: Appendix A, Analytica Users Guide
Precision required for Mean(Normal(0,1) * Normal(0,1)) • Computed mean should be within 0.05 of the correct mean. (Δ=0.05) • How many samples do we need? • StdDev 1.2 • sampleSize > (4.8/0.05)2 = 9216
Pure Monte Carlo Randomness Clusters of over-coverage Poor Coverage (20 points sampled)
Pure Monte Carlo Randomness Clusters of over-coverage Poor Coverage (20 points sampled)
Pure Monte Carlo Randomness Clusters of over-coverage Poor Coverage (20 points sampled)
Latin Hypercube Sampling • Every 5% of area has one point. Vertical green lines every 10%. Two points always in each 10% region.
Latin Hypercube Sampling • CDF of same sample Vertical green lines every 10%. Two points always in each 10% region.
+1 Area of circle = π y -1 -1 x +1 Area of square = 4 Exercise • Compute π by sampling. • Use SampleSize=100 • Compare precision for: • Pure Monte Carlo • Median Latin Hypercube • Random Latin Hypercube • Here’s how: • x,y ~ Uniform(-1,1) • Probability(x^2+y^2<1) is π/4
Uncertainty Views • All uncertainty viewsare computed fromthe sample. • Mean Value • Statistics • Bands • PDF • CDF • Sample
Sample Statistics Given the 10-point sample: [2.0, 2.5, 2.9, 3.2, 3.5, 3.9, 4.3, 4.8, 5.5, 7.0] • What is the median? (3.5+3.9)/2 = 3.7 • What is the sample mean? (2.0+2.5+2.9+3.2+3.5+3.9+4.3+4.8+5.5+7.0)/10=3.96 • What is the sample variance? (2.0-3.96)2+(2.5-3.96)2+..+(7.0-3.96)2 ) / 9 = 2.26 • What is the sample standard deviation? Sqrt(2.26) = 1.5
20% 10% 30% 40% 50% 60% 70% 80% 90% 100% 0% Fractiles (percentiles, Probability Bands) Given the 10-point sample: [2.0, 2.5, 2.9, 3.2, 3.5, 3.9, 4.3, 4.8, 5.5, 7.0] • What is the 25% fractile? • Answer: 2.9 • What is the 60% fractile? • Answer: 4.1
Tricks for SmoothingProbability Density Plots • Sample Size • Samples per PDF step • 1.6 * 2.5^logten(sampleSize) • Equal P vs. Equal X • Line style • Histo vs. line • Manual axis scaling • (when extremes present)
Evaluation Modes • Analytica has two evaluation modes: • Mid mode • Sample mode • Mid result view uses Mid-mode • Uncertainty functions return the Median. • All other result views use Sample-mode • Uncertainty functions return a sample.
Summary • A Sample is a way of representing an arbitrary distribution of uncertainty. • Enables uncertainty analysis for arbitrary computations (Monte Carlo). • Analytica’s Run index associates scenarios between the samples of different variables. • All result uncertainty views are derived from the computed sample.