Download
1 / 37
390 likes | 565 Views
Successful IT Projects By Darren Dalcher & Lindsey Brodie. Chapter 8. www.thomsonlearning.co.uk/fasttrack. Lecture 8. Project Quality Management. Learning outcomes. Understand the importance of quality management

E N D
Successful IT ProjectsByDarren Dalcher & Lindsey Brodie Chapter 8 www.thomsonlearning.co.uk/fasttrack
Lecture 8 Project Quality Management
Learning outcomes • Understand the importance of quality management • Describe the main processes of project quality management and understand how they relate to projects • Describe several quality control techniques • Understand the contribution of the major quality experts to quality management • Discuss quality standards and models
What is quality? • Quality of design: • Decide the level of quality required - characteristics of the product or service such as grade of materials and performance specifications • Quality of conformance: • The degree to which the design specifications are met or ‘conformance to requirements’ • Fitness for purpose: • Means that the product can be used for the purpose it was intended. Usually considered more rigorous than ‘fitness for use’
Different views of quality • Quality as: • A product-based quantity • A user-based view • A specification • A value-based approach • A transcendent property • A continuous property
The cost of quality • Cost of quality (COQ) includes all the costs associated with quality-related processes • Cost of quality factors: • Prevention costs (includes quality planning, technical reviews, test equipment and training) • Appraisal costs (includes inspections and testing) • Failure costs • Internal failure costs (rework) • External failure costs (helpline support and fixing customer fault reports)
The cost of quality Crosby (1980) COQ = POC + PONC Cost of quality (COQ) Price of conformance (POC): price of ensuring “things are done right the first time”. The sum of prevention costs and appraisal costs Price of non-conformance (PONC): the failure costs
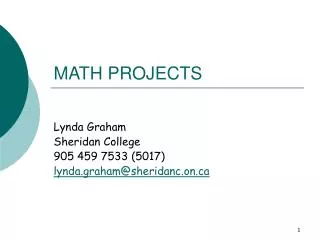
Cost to fix escalates as you move towards field use 40 - 1000x 82x IBM average 30 - 70x Relative cost to fix an error 15 - 40x 10x 3 - 6x 1 Development Testing Acceptance Testing Operation Requirements Design Coding
Project quality management • Quality planning: • Identifying the relevant requirements, quality procedures and standards, and determining how a project will meet them. Must have both product/system metrics and project process metrics • Quality assurance: • Carrying out the planned quality activities to ensure the project delivers a quality product/service • Quality control: • Monitoring the project results to ensure they meet the relevant quality standards. Outputs include quality control status reports, rework and process improvements
Quality control methods • Management reviews • Testing • Pareto analysis • Control charts • Walkthroughs • Inspections Already discussed in Lecture 4
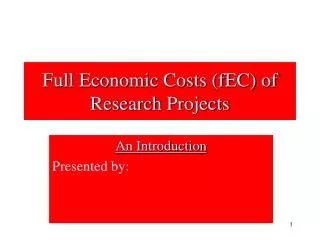
An example of a Pareto diagram (Note all percentages are rounded down) 100% 200 185 160 80% 142 Number of defects reported over a given time period 60% 120 Cumulative Percentage 80 40% 20% 40 30 20 10 0 0% Insufficient Qualifier Data Missing Source Information Missing Benchmark Data Missing Status Data Missing Target Level
An example of a control chart Upper Control Limit Violation of control limits 3 2 Time Mean 2 3 Lower Control Limit
Control charts • Chance causes: tend to lie within the control limits - only a one in a thousand chance of not doing so • Special causes (assignable causes or sporadic causes): controlled at the local or operational level. Eliminating these means the process returns to its controlled state. Identified by looking for patterns that suggest non-random behaviour in the control chart. Corrective actions are needed to remove special causes. For example, can detect when manufacturing equipment is becoming defective • Common causes (endemic causes or chronic causes): inherent in the process, only if the basic process is altered will they change
Walkthroughs • A walkthrough is a type of peer group review • Informal and lasts 1 to 1.5 hours • Purpose is no enforce standards, detect errors and improve visibility of the material and overall system quality • Product author typically describes the structure and logic of the material being reviewed • A co-ordinator plans and organises the walkthrough • An action list of problems and questions is generated • Outcome is a decision about whether the material can be accepted as it is or whether it needs revision and even a further walkthrough
Inspections • Carried out on written documentation • Originally developed by Michael Fagan for use on source code • Now extended by Tom Gilb for use on earlier system documents (requirements specifications and even contracts) • Also extended by Robert Mays (IBM) to support continuous process improvement • Gilb has moved focus from defect finding and fixing towards sampling to determine quality (better to rewrite than fix if a high number of defects)
Inspection • Inspection must be economic • Can be used for training about standards • Does not replace testing, but can be argued to find defects earlier • Checkers are given roles • Use rules and checklists to find ‘issues’ • Check against source and kin documents • Author has final say if ‘issues’ are ‘defects’
Main Specification, Source Documents, Kin Documents, Rules and Checklists Overview of the inspection process Process Meeting Entry Planning Kickoff Checking Specification Meeting Edit Exit Edit Audit Strategy Statistics Quality Checked Main Specification, Change Requests for Source and Kin Documents and Suggested Process Improvements
Quality metrics How can quality be expressed? • Think back to Lecture 2 and the discussion on success criteria being picked up as project objectives • Remember Doran’s SMART method • Think back also to Lecture 4 and the discussion about quality requirements • Earlier in this lecture under quality planning, we mentioned product/system metrics and project process metrics
Key contributors to the quality movement • Walter Shewhart • W. Edwards Deming • Joseph Juran • Philip Crosby • Kaoru Ishikawa
Walter Shewhart • Encouraged managers to think about problem prevention and process improvement • Developed: • The control chart (discussed earlier) • The Plan/Do/Check/Act cycle for process improvement
The Shewhart Cycle or Deming Cycle Decide Actions Needed Plan Actions Act Plan Study* Do Study Results of Actions Taken Execute Plans * Shewhart used ‘Check’, while Deming preferred ‘Study’
W. Edwards Deming • Deming popularised the Shewhart cycle • Came to fame after working in Japan to help the Japanese improve the quality of their manufactured products • Promoted the concept: • Quality is a management issue: common causes often beyond the ability of the worker to fix and so require management action
Joseph Juran • Juran defined quality from a customer’s viewpoint as ‘fitness for use’ (five attributes: quality of design, quality of conformance, availability, safety and field use) • Juran’s message was that quality must be planned • The ‘Juran Trilogy’ • Quality planning • Quality improvement • Quality control
Philip Crosby Cost of Quality (COQ) = Price of Conformance (POC) + Price of Non-conformance (PONC) 4 Absolutes of Quality Management: Quality is defined as conformance to requirements Quality comes from prevention Quality sets the performance standard at ‘zero defects’ Quality is measured by the cost of non-conformance Insisted that ‘Quality is Free’
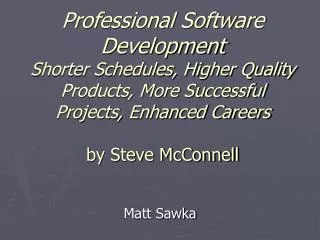
Kaoru Ishikawa • Developed: • Quality circles: teams within one or more organisations meet regularly to discuss how to improve a work process. They devise and try out corrective actions, and report back. Meetings are held until the team decides to disband • ‘Cause and effect’ diagrams known as Ishikawa diagrams or fishbone diagrams
An Ishikawa diagram or fishbone diagram Inexperienced project team Too many bugs Lack of inspections Insufficient prior project experience Too many last minute changes Poor training Work rushed Software not delivered on-time Requirements specification too imprecise New hardware arrived late Too much rework Poor documentation Unrealistic deadlines Lack of knowledge of Evaluation Criteria New technology Too much work Other?
Continuous improvement • Continuously striving to produce better products and improve processes • Key requirement is that an organisation has stable processes so that the impact of any change can be understood. (Often misinterpreted as that an organisation has to have processes!)
Six Sigma • Holistic approach to quality. An organisation sets high six sigma goals and uses continuous process improvement • Six sigma goal is no more than 3.4 defects per million opportunities (think back to control charts) • Adopted by Motorola and General Electric Company (GEC) • Builds on the work of the quality gurus such as Deming, Juran and Crosby • Originally a five step DMAIC improvement process. It has now become eight step
Six Sigma improvement process • Identify the project • Define the project • Measure current process performance • Analyse/probe the problem • Develop the improved process • Implement the changes • Control - measure and hold the gains • Communicate - exploit the achievement in other areas
Industry quality standards ISO 9000:2000 Standards for quality management with respect to improved customer satisfaction and continuous improvement. Focuses on eight principles: • Customer focus • Leadership • Involvement of people • Process approach • System approach to management • Continual improvement • Factual approach to decision making • Mutually beneficial supplier relationships See http://www.iso.org
Industry quality standards TickIT • TickIT provides a framework for organisations to get certification under the ISO 9001:2000 framework • Develops quality management system certification procedures: • Publishes guidance material for interpreting the requirements of ISO 9001 • Advises on training, selecting and registering auditors with IT experience and competence • Introduces rules for the accreditation of certification bodies in the software sector (see http://www.tickit.org)
Maturity models • Provide frameworks for organisations to assess their overall capability • Aim to help organisations understand what they need to do to achieve process improvement or enhance organisational capability
Capability Maturity Model Integration (CMMI) • Developed by the Software Engineering Institute (SEI) at Carnegie Mellon university. See http://www.sei.cmu.edu • Originally CMM but integrated other models to become CMMI • Two instantiations: • Staged CMMI: assesses a whole organisation’s process capability at one of five maturity levels • Continuous CMMI: assesses different process areas across an organisation individually, so a set of maturity levels results
The CMMI staged diagram:the maturity levels Level 5 Optimising Level 4 Quantitatively Managed Level 3 Defined Level 2 Managed Level 1 Initial
CMMI • Maturity Level 1: Initial: processes are ad hoc and chaotic • Maturity Level 2: Managed: processes are planned, performed, measured and controlled • Maturity Level 3: Defined: Processes are qualitatively predictable • Maturity Level 4: Quantitatively Managed: Processes are understood in statistical terms and special causes are addressed. Processes are quantitatively predictable • Maturity Level 5: Optimising: Focus on improving process performance by removing common causes
Project management maturity models • Aim to improve and standardise project management processes • The Project Management Institute (PMI) produced an Organizational Project Management Maturity Model (OPM3). • This builds on the project management processes described in Lecture 1 (initiating processes, planning processes, executing processes, monitoring and controlling processes, and closing processes) • Extends into programme and portfolio management (think back to Lecture 2)
Summary • Discussed: • Current ideas on project quality management • Key people who have shaped quality management • Seen that Quality: • Must be designed into a product • Not just about errors and their elimination: it is also about prevention • Is a dynamic concept • Is concerned with the usefulness and acceptability of a product to its users and the project clients