Download
1 / 1
10 likes | 313 Views
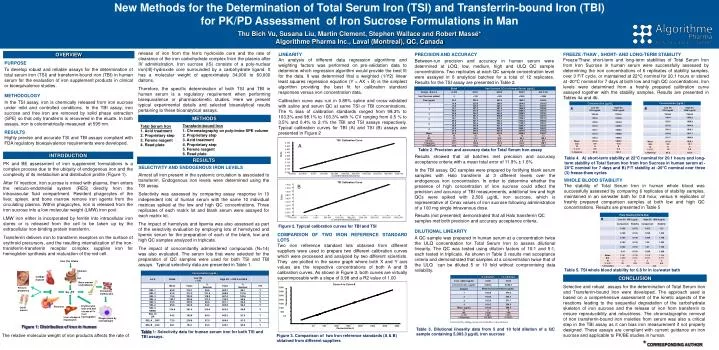
New Methods for the Determination of Total Serum Iron (TSI) and Transferrin-bound Iron (TBI) for PK/PD Assessment of Iron Sucrose Formulations in Man Thu Bich Vu, Susana Liu, Martin Clement, Stephen Wallace and Robert Massé* Algorithme Pharma Inc., Laval (Montreal), QC, Canada.

E N D
New Methods for the Determination of Total Serum Iron (TSI) and Transferrin-bound Iron (TBI) for PK/PD Assessment of Iron Sucrose Formulations in Man Thu Bich Vu, Susana Liu, Martin Clement, Stephen Wallace and Robert Massé* Algorithme Pharma Inc., Laval (Montreal), QC, Canada Curve A vs Curve B TBI Calibration Curve TSI Calibration Curve 1.400 3500 0.700 1.200 3000 0.600 1.000 2500 0.500 ConcentrationB 0.800 2000 0.400 Delta Delta 0.600 1500 0.300 0.400 1000 0.200 0.200 500 0.100 0.000 0.000 0.0 -0.200 -0.100 -0.400 -0.200 -1000.000 -500.000 0.000 500.000 1000.000 1500.000 2000.000 2500.000 3000.000 3500.000 -400.000 -200.000 0.000 0.0 200.000 500 400.000 1000 600.000 1500 800.000 2000 1000.000 2500 1200.000 3000 1400.000 1600.000 3500 <Concentrations/Dilutions> <Concentrations/Dilutions> Concentration A Iron (Fe) intake Stomach Cardiac muscle Gut Bone marrow erythroblasts Fetus in pregnancy Circulating erythrocytes Fe 2TF Pancreas release of iron from the ferric hydroxide core and the rate of clearance of the iron carbohydrate complex from the plasma after IV administration. Iron sucrose (IS) consists of a poly-nuclear iron(III)-hydroxide core surrounded by a carbohydrate ligand. It has a molecular weight of approximately 34,000 to 60,000 daltons. Therefore, the specific determination of both TSI and TBI in human serum is a regulatory requirement when performing bioequivalence or pharmacokinetic studies. Here we present typical experimental details and selected bioanalytical results pertaining to these bioanalytical assays. OVERVIEW LINEARITY An analysis of different data regression algorithms and weighting factors was performed on pre-validation data to determine which regression algorithm would provide the best fit for the data. It was determined that a weighted (1/Y2) linear least squares regression equation (Y = AX + B) is the simplest algorithm providing the best fit for calibration standard responses versus iron concentration data. Calibration curve was run in 0.85% saline and cross-validated with saline and serum QC at same TSI or TBI concentrations. The % bias of calibration standards ranged from 98.3% to 103.3% and 98.1% to 103.3% with % CV ranging from 0.5 % to 3.5% and 0.4% to 2.1% the TBI and TSI assays respectively. Typical calibration curves for TBI (A) and TSI (B) assays are presented in Figure 2 PRECISION AND ACCURACY Between-run precision and accuracy in human serum were determined at LOQ, low, medium, high and ULQ QC sample concentrations. Two replicates at each QC sample concentration level were assayed in 6 analytical batches for a total of 12 replicates. Results for the TSI assay are presented in Table 2. FREEZE /THAW , SHORT- AND LONG-TERM STABILITY Freeze/Thaw, short-term and long-term stabilities of Total Serum Iron from Iron Sucrose in human serum were successfully assessed by determining the iron concentrations of 6 replicates of stability samples, over 3 F/T cycle, or maintained at 22°C nominal for 20.1 hours or stored at -20°C nominal for 7 days at both low and high QC concentrations. Iron levels were determined from a freshly prepared calibration curve assayed together with the stability samples. Results are presented in Tables 4a and 4b. • Transferin-bound Iron • Chromatography on poly-imine SPE column • Proprietary step • Acid treatment • Proprietary step • Ferene reagent • Read plate Total Serum Iron Acid treatment Proprietary step Ferene reagent Read plate Other muscle Erythrocytes lysis and and release of Fe from haemoglobin PURPOSE To develop robust and reliable assays for the determination of total serum iron (TSI) and transferrin-bound iron (TBI) in human serum for the evaluation of iron supplement products in clinical or bioequivalence studies. METHODOLOGY In the TSI assay, iron is chemically released from iron sucrose under mild and controlled conditions. In the TBI assay, iron sucrose and free iron are removed by solid phase extraction (SPE) so that only transferrin is recovered in the eluate. In both assays, iron is colorimetrically measured at 595 nm. RESULTS Highly precise and accurate TSI and TBI assays compliant with FDA regulatory bioequivalence requirements were developed. Liver storage in hepatocytes Phagocytosis by macrophages METHODS A Table 2. Precision and accuracy data for Total Serum Iron assay INTRODUCTION Results showed that all batches met precision and accuracy acceptance criteria with a mean total error of 11.9% ± 1.6% In the TBI assay, QC samples were prepared by fortifying blank serum samples with Halo transferrin at 3 different levels over the endogenous iron concentration. In order to determine whether the presence of high concentration of iron sucrose could affect the precision and accuracy of TBI measurements, additional low and high QCs were spiked with 2,500 µg/dL iron sucrose, which is representative of Cmax values of iron sucrose following administration of a 100 mg single intravenous dose. Table 4. A) short-term stability at 22°C nominal for 20.1 hours and long-term stability of Total Serum Iron from Iron Sucrose in human serum at -20°C nominal for 7 days and B) F/T stability at -20°C nominal over three (3) freeze-thaw cycles RESULTS PK and BE assessment of iron supplement formulations is a complex process due to the ubiquity of endogenous iron and the complexity of its metabolism and distribution profile (Figure 1). After IV injection, iron sucrose is mixed with plasma, then enters the reticulo-endothelial system (RES) directly from the intravascular fluid compartment. Resident phagocytes of the liver, spleen, and bone marrow remove iron agents from the circulating plasma. Within phagocytes, iron is released from the iron sucrose into a low molecular weight (LMW) iron pool. LMW iron either is incorporated by ferritin into intracellular iron stores or is released from the cell to be taken up by the extracellular iron-binding protein transferrin. Transferrin delivers iron to transferrin receptors on the surface of erythroid precursors, and the resulting internalization of the iron-transferrin-transferrin receptor complex supplies iron for hemoglobin synthesis and maturation of the red cell. SELECTIVITY AND ENDOGENOUS IRON LEVELS Almost all iron present in the systemic circulation is associated to transferrin. Endogenous iron levels were determined using the TSI assay. Selectivity was assessed by comparing assay response in 10 independent lots of human serum with the same 10 individual matrices spiked at the low and high QC concentrations.Three replicates of each matrix lot and blank serum were assayed for each matrix lot. The impact of hemolysis and lipemia was also assessed as part of the selectivity evaluation by employing lots of hemolyzed and lipemic serum for the preparation of each of the blank, low and high QC samples analyzed in triplicate. The impact of concomitantly administered compounds (N=14) was also evaluated. The serum lots that were selected for the preparation of QC samples were used for both TSI and TBI assays. Typical selectivity data are presented in Table 1. WHOLE BLOOD STABILITY The stability of Total Serum Iron in human whole blood was successfully assessed by comparing 6 replicates of stability samples, maintained in an ice/water bath for 0.8 hour, versus 6 replicates of freshly prepared comparison samples at both low and high QC concentrations. Results are presented in Table 5 B Results (not presented) demonstrated that all Halo transferrin QC samples met both precision and accuracy acceptance criteria. Figure 2. Typical calibration curves for TBI and TSI DILUTIONAL LINEARITY A QC sample was prepared in human serum at a concentration twice the ULQ concentration for Total Serum Iron to assess dilutional linearity. The QC was tested using dilution factors of 10:1 and 5:1, each tested in triplicate. As shown in Table 3 results met acceptance criteria and demonstrated that samples at a concentration twice that of the ULQ can be diluted 5 or 10 fold without compromising data reliability. * Corrected by adding serum iron baseline concentration COMPARISON OF TWO IRON REFERENCE STANDARD LOTS Two iron reference standard lots obtained from different suppliers were used to prepare two different calibration curves which were processed and analyzed by two different scientists. They are plotted in the same graph where both X and Y axis values are the respective concentrations of both A and B calibration curves. As shown in Figure 3, both curves are virtually superimposable with a slope of 0.98 and a R2 value of 1.00 Table 5. TSI whole blood stability for 0.8 hr in ice/water bath CONCLUSION Selective and robust assays for the determination of Total Serum Iron and Transferrin-bound Iron were developed. The approach used is based on a comprehensive assessment of the kinetic aspects of the reactions leading to the sequential degradation of the carbohydrate skeleton of iron sucrose and the release of iron from transferrin to ensure reproducibility and robustness. The chromatographic removal of non transferrin-bound iron moieties from serum was also a critical step in the TBI assay as it can bias iron measurement if not properly designed. These assays are compliant with current guidance on iron sucrose and applicable to PK/BE studies in human. Figure 1: Distribution of iron in human Table 3. Dilutional linearity data from 5 and 10 fold dilution of a QC sample containing 5,083.3 µg/dL iron sucrose Table 1: Selectivity data for human serum iron for both TSI and TBI assays. The relative molecular weight of iron products affects the rate of Figure 3. Comparison of two Iron reference standards (A & B) obtained from different suppliers * CORRESPONDING AUTHOR