Download
1 / 13
130 likes | 279 Views
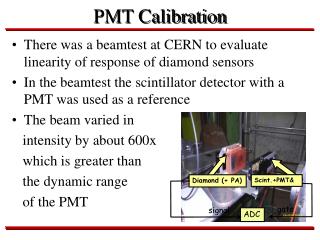
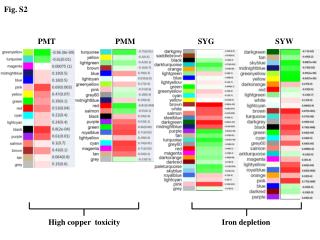
Metrics GSCS PMT. - Turnaround Time - Quality of Routing - Quality of Assessment. Bret Bullard 8/2/2010. TAT. TAT and On Hold issues. TAT and On Hold issues. NR Volumes (April/May/June).

E N D
Metrics GSCS PMT - Turnaround Time - Quality of Routing - Quality of Assessment Bret Bullard 8/2/2010
NR Volumes (April/May/June) Monthly Totals 103 152 162 250 274 524
AMS/Global Ams/Global Avg. TAT 23 hrs. 56 min. Avg. TAT 18 hr. 11 min. Avg. TAT 1day 10 hrs. 47 mins. May requests are from May 12th to May 31st due to release of redesigned tool.
EMEA/APJ Emea/apj Avg. TAT 19 hrs. 48 mins. Avg. TAT 17 hrs. 33 mins. Avg. TAT 19 hrs. 29 mins. May requests are from May 12th to May 31st due to release of redesigned tool.
Quality of Routing & Assessment Improvements to the NR form Request status New In Progress Rejected Completed Return to Business Partner On Hold Return to Partner Manager • Was PM assessment/recommendation helpful or useful? • N/A • Yes • No
What’s been updated Meetings • Luiza • Jeff & Teresa • PM Teams • Reporting individuals • Luiza • Jeffery & Matthew • Teresa Objectives & Solutions • TAT for category • Implement NR form updates with NR tools team and Jeff • Create a complete walkthrough on how to calculate an accurate TAT assuming that the appropriate changes have been completed. (Goal: 80% of the requests can be used to calculate TAT.) • Create a complete walkthrough on how to calculate an accurate TAT by category.
Time Constraints updated Calculating an accurate TAT for a month with automated reporting in Access *Thanks to Jeffrey Clayton and Matthew Costello • An experienced reporter (1.5 hrs.) • A knowledgeable reporter (3 hrs.) • Someone following a written walk through (5 hrs.) Calculating TAT for all requests including the ones placed On Hold • Encompasses all requests but not as accurately (3 min.) Calculating TAT by category • Calculating TAT of the PM for each category (3 min.) (2-3 min.) (3 min.) (5 min.)
Documentation TAT • Access and Excel reports for checking accuracy of data w/ walk through • Creating the pie charts and volume graphs • Automated reports from Access w/ walk through document • Volume reports • System Suggestions/Recommendations Document • Mid-summer & Final presentation slide show Quality of Routing/Assessment • GSCS efficiency metric