Download
1 / 40
400 likes | 572 Views
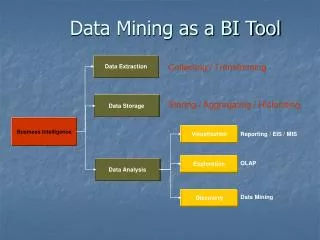
An Excel-based Data Mining Tool. Chapter 4. 4.1 The iData Analyzer. 4.2 ESX: A Multipurpose Tool for Data Mining. 4.3 iDAV Format for Data Mining. 4.4 A Five-step Approach for Unsupervised Clustering. Step 1: Enter the Data to be Mined Step 2: Perform a Data Mining Session

E N D
An Excel-based Data Mining Tool Chapter 4
4.4 A Five-step Approach for Unsupervised Clustering Step 1: Enter the Data to be Mined Step 2: Perform a Data Mining Session Step 3: Read and Interpret Summary Results Step 4: Read and Interpret Individual Class Results Step 5: Visualize Individual Class Rules
Step 3: Read and Interpret Summary Results Class Resemblance Scores Domain Resemblance Score Domain Predictability
Summary Results • Class Resemblance Score offers a first indication about how well the instances within each class (cluster) fit together. • Domain Resemblance Score represents the overall similarity of all instances within the data set. • It is highlydesirable that class resemblance scores are higher that the domain resemblance score
Summary Results • Given categorical attribute A with values v1, v2, v3, …, vi,… vn, the Domain Predictability of vi tells us the domain instances showing vi as a value for A. • A predictability score near 100% for a domain-level categorical attribute value indicates that the attribute is not likely to be useful for supervised learning or unsupervised clustering
Summary Results • Given categorical attribute A with values v1, v2, v3, …, vi,… vn, the Class C Predictability score for vi tells us the percent of instances within class C shoving vi as a value for A. • Given class C and categorical attribute A with values v1, v2, v3, …, vi,… vn, an Attribute-Value Predictiveness score for vi is defined as the probability an instance resides in C given the instance has value vi for A.
Domain Statistics for Numerical Attributes • Attribute Significance Value measures the predictive value of each numerical attribute. • To calculate the Attribute Significance Value for a numeric attribute, it is necessary to: a) subtract the smallest class mean from the largest mean value; b) divide this result by the domain standard deviation
Figure 4.8 Summery statistics for the Acme credit card promotion database
Figure 4.9 Statistics for numerical attributes and common categorical attribute values
Step 4: Read and Interpret Individual Class Results Class Predictability is a within-class measure. Class Predictiveness is a between- class measure.
Necessary and Sufficient Attribute Values • If an attribute value has a predictability and predictiveness score of 1.0, the attribute value is said to be necessary and sufficient for membership in class C. That is, all instances within class C have the specified value for the attribute and all instances with this value for the attribute reside in class C.
Sufficient Attribute Values • If an attribute value has a predictiveness score of 1.0 and a predictability score less than 1.0, the attribute value is said to be sufficient but not necessary for membership in class C. That is, all instances with the value for the attribute reside in C, but there are other instances in C that have a different value for this attribute.
Necessary Attribute Values • If an attribute value has a predictabilityscore of 1.0 and a predictiveness score less than 1.0, the attribute value is said to be necessary but not sufficient for membership in class C. That is, all instances in C have the same value for the attribute, but there are other instances outside C, have the same value for this attribute.
Necessary and Sufficient Attribute Values in iDA • The attribute values with predictiveness scores greater than or equal to 0.8 are considered as highly sufficient. • The attribute values with predictability scores greater than or equal to 0.8 are considered as necessary.
Figure 4.11 Necessary and sufficient attribute values for Class 3
Rule Interpretation in iDA • Each rule simply declares the precondition(s) necessary for an instance to be covered by the rule: • if [(condition & condition &…& condition)=true] thenan instance resides in a certain class.
Rule Interpretation in iDA • Rule accuracy tells us the rule is accurate in …% of all cases where it applies. • Rule coverage shows that the rule applies that the rule applies to …% of class instances
4.5 A Six-Step Approach for Supervised Learning Step 1: Choose an Output Attribute Step 2: Perform the Mining Session Step 3: Read and Interpret Summary Results Step 4: Read and Interpret Test Set Results Step 5: Read and Interpret Class Results Step 6: Visualize and Interpret Class Rules
Read and Interpret Test Set Results Figure 4.12 Test set instance classification
4.6 Techniques for Generating Rules Define the scope of the rules. Choose the instances. Set the minimum rule correctness. Define the minimum rule coverage. Choose an attribute significance value.
Typicality Scores Identify prototypical and outlier instances. Select a best set of training instances. Used to compute individual instance classification confidence scores.
4.8 Special Considerations and Features Avoid Mining Delays The Quick Mine Feature Erroneous and Missing Data