Download
1 / 29
290 likes | 300 Views
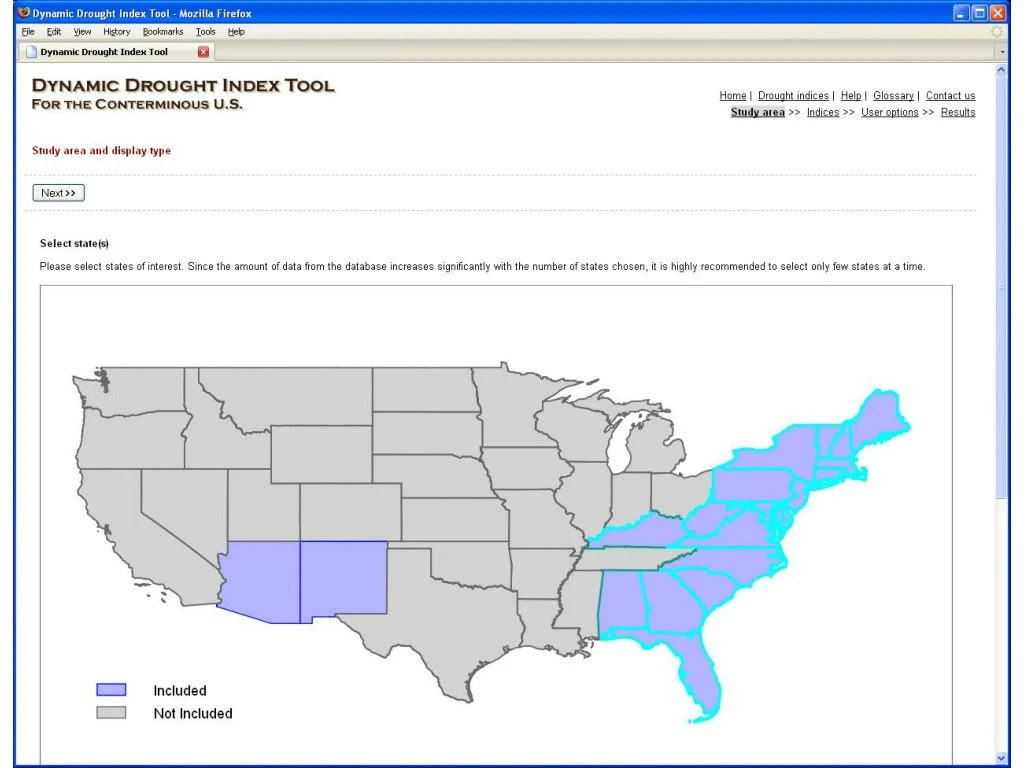
This system provides mapping and comparison tools for climate data, including drought indices, streamflow, precipitation, and more. Users can visualize and analyze data using GIS tools, navigate maps, and export results in various formats.

E N D
Structure • ACIS • Applied Climate Information System • NWIS • National Water Information System • ECMAScript • Standardized JavaScript • PHP • PHP: Hypertext Preprocessor • SVG • Scalable Vector Graphics
* Rhee, J. and G.J. Carbone. A Comparison of Weekly Monitoring Methods of the Palmer Drought Index. Journal of Climate 20(24): 6033-6044.
Percentile: 22.78 Raw data: - 0.75 Percentiles Using Empirical Cumulative Distributions • Total 55 years (1950 ~ 2004) • Palmer indices and SPI: all stations, all months • Streamflow and precipitation: each station, each month Steinmann, A. 2003. Drought indicators and triggers: A stochastic approach to evaluation. Journal of the American Water Resources Association 39: 1217–1233.
No data Interpolation • 4 km X 4 km grids • Available weather stations within a fixed radius circle (i.e. 50 km) • Inverse Distance Weighted; Kriging Rhee, J., G. J. Carbone, and J. Hussey. 2008. Drought index mapping at different spatial units. Journal of Hydrometeorology DOI: 10.1175/2008JHM983.1.
Aggregation Rhee, J., G. J. Carbone, and J. Hussey. 2008. Drought index mapping at different spatial units. Journal of Hydrometeorology DOI: 10.1175/2008JHM983.1.
Map Navigation Tools GIS Tools Metadata
Comparisons of multi-maps on one screen Comparing: - spatial layers - indices - months/weeks/days)
Output Options - Scalable vector graphics (SVG) - Arc shapefiles - Google Earth overlay (& KML export) - Excel spreadsheets (for tables)