Download
1 / 32
330 likes | 529 Views
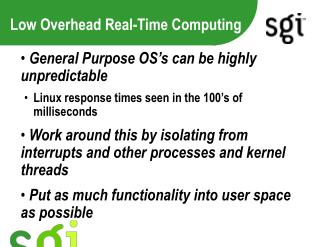
Low Overhead Debugging with DISE. Marc L. Corliss E Christopher Lewis Amir Roth Department of Computer and Information Science University of Pennsylvania . Overview. Goal : Low overhead interactive debugging Solution : Implement efficient debugging primitives

E N D
Low Overhead Debugging with DISE Marc L. Corliss E Christopher Lewis Amir Roth Department of Computer and Information Science University of Pennsylvania
Overview • Goal: Low overhead interactive debugging • Solution: Implement efficient debugging primitives • e.g. breakpoints and watchpoints • using Dynamic Instruction Stream Editing (DISE) [ISCA ‘03]:General-purpose tool for dynamic instrumentation Low Overhead Debugging with DISE – Marc Corliss
Breakpoints and Watchpoints • Breakpoint • Interrupts program at specific point • Watchpoint • Interrupts program when value of expression changes • Conditional Breakpoint/Watchpoint • Interrupts program only when predicate is true break test.c:100 watch x break test.c:100 if i==93 Low Overhead Debugging with DISE – Marc Corliss
Debugging Architecture User Debugger Application • User/debugger transitions • Debugger/application transitions • High overhead • May be masked by user/debugger transitions • Otherwise perceived as latency int main() { } Spurious Transitions Low Overhead Debugging with DISE – Marc Corliss
Eliminating Spurious Transitions • Instrument app. with breakpoint/watchpoint logic • No spurious transitions • Static approaches already exist • During compilation or post-compilation (binary rewriting) • We propose dynamic instrumentation • Using DISE Low Overhead Debugging with DISE – Marc Corliss
Talk Outline • Introduction • Watchpoint implementations • DISE background • Watching with DISE • Evaluation • Related work and conclusion Low Overhead Debugging with DISE – Marc Corliss
Watchpoint Implementations • Single-stepping • Virtual memory support • Dedicated hardware registers Low Overhead Debugging with DISE – Marc Corliss
Single-Stepping User Application int main() { } Debugger Debugger Application run int main() { } diff? no diff? no diff? no yes diff? Trap after every statement • Easy to implement • Poor performance (many spurious transitions) Low Overhead Debugging with DISE – Marc Corliss
Virtual Memory Support Debugger Application run int main() { } page written diff? page written diff? page written yes diff? Trap when pages containing watched variables written • Reduces spurious transitions • Coarse-granularity (still may incur spurious transitions) • Spurious transitions on silent writes Low Overhead Debugging with DISE – Marc Corliss
Dedicated Hardware Registers run watchpt written diff? watchpt written yes diff? Trap when particular address is written Debugger Application int main() { } • Reduces spurious transitions • Spurious transitions on silent writes • Number and size of watchpoints limited Low Overhead Debugging with DISE – Marc Corliss
Conditional Watchpoints run diff? pred? diff? pred? yes diff? pred? Trap like unconditional, debugger evaluates predicate • Simple extension of unconditional implementation • Introduces more spurious transitions Debugger Application int main() { } Low Overhead Debugging with DISE – Marc Corliss
Instrumenting the Application run diff? pred? diff? pred? diff? pred? Embed (conditional) watchpoint logic into application • Eliminates all spurious transitions • Adds small overhead for each write Debugger Application int main() { } Low Overhead Debugging with DISE – Marc Corliss
DISE srli r9,4,r1 cmp r1,r2,r1 bne r1,Error store r4,8(r9) • Example: memory fault isolation store r4,8(r9) app+instrumentation app • Dynamic Instruction Stream Editing (DISE)[ISCA ‘03] • Programmable instruction macro-expander • Like hardware SED (DISE = dynamic instruction SED) • General-purpose mechanism for dynamic instrumentation I$ DISE execute Low Overhead Debugging with DISE – Marc Corliss
DISE Productions Directive Pattern DISE Register Parameterized replacement sequence Expansion: dynamic instantiation of production srli r9,4,dr0 cmp dr0,dr1,dr0 bne dr0,Error store r4,8(r9) store r4,8(r9) Production: static rewrite rule T.OPCLASS==store =>srli T.RS,4,dr0 cmp dr0,dr1,dr0 bne dr0,Error T.INST Low Overhead Debugging with DISE – Marc Corliss
Watching with DISE • Monitor writes to memory • Check if watched value(s) modified • Requires expensive load(s) for every write • Optimization: address match gating • Split into address check (fast) and value check (slow) • Check if writing to watched address • If so, then handler routine called • Handler routine does value check Low Overhead Debugging with DISE – Marc Corliss
Watchpoint Production • Interactive debugger injects production: T.OPCLASS == store =>T.INST # original instruction lda dr1,T.IMM(T.RS) # compute address bic dr1,7,dr1 # quad align address cmpeq dr1,dwr,dr1 # cmp to watched address ccall dr1,HNDLR # if equal call handler Low Overhead Debugging with DISE – Marc Corliss
Other Implementation Issues • Conditional watchpoints • Inline simple predicates in replacement sequence • Put complex predicates in handler routine • Multiple watchpoints/complex expressions • For small #, inline checks in replacement sequence • For large #, use bloom filter Key point: DISE is flexible Low Overhead Debugging with DISE – Marc Corliss
Virtues of DISE • Versus dedicated hardware registers • General-purpose: DISE has many other uses • Safety checking [ISCA ‘03], security checking [WASSA ‘04],profiling [TR ‘02], (de)compression [LCTES ‘03], etc. • Efficient: no spurious transitions to the debugger • Flexible: more total watchpoints permitted • Versus static binary transformation • Simple-to-program: transformation often cumbersome • Efficient: no code bloat, no transformation cost • Less intrusive: Debugger and application separate Low Overhead Debugging with DISE – Marc Corliss
Evaluation • Show DISE efficiently supports watchpoints • Compare performance to other approaches • Analyze debugging implementations in general • Characterize performance of different approaches Low Overhead Debugging with DISE – Marc Corliss
Methodology • Simulation using SimpleScalar Alpha • Modeling aggressive, 4-way processor • Benchmarks • (subset of) SPEC Int 2000 • Watchpoints for each benchmark • HOT, WARM1, WARM2, COLD • Debugger/application transition overhead • 100,000 cycles Low Overhead Debugging with DISE – Marc Corliss
Unconditional Watchpoints GCC Single-stepping has slowdowns from 6,000-40,000 Low Overhead Debugging with DISE – Marc Corliss
Unconditional Watchpoints GCC • VM sometimes good, sometimes awful • Erratic behavior primarily due to coarse-granularity Low Overhead Debugging with DISE – Marc Corliss
Unconditional Watchpoints GCC • Hardware registers usually good (no overhead) • Hardware registers perform poorly for HOT • Significant number of silent writes Low Overhead Debugging with DISE – Marc Corliss
Unconditional Watchpoints GCC • DISE overhead usually less than 25% Low Overhead Debugging with DISE – Marc Corliss
Conditional Watchpoints • In many cases DISE outperforms hardware regs. • Spurious transitions for HW regs. whenever WP written • DISE/HW registers can differ by 3 orders of magnitude Low Overhead Debugging with DISE – Marc Corliss
Conditional Watchpoints • Instrumentation overhead more consistent • Instrumentation adds small cost on all writes • Non-instrumentation adds high cost on some writes Low Overhead Debugging with DISE – Marc Corliss
Multiple Watchpoints GCC • For <5 watchpoints can use hardware registers • Performance good 1-3, degrades at 4 due to silent writes • For >4 watchpoints must use virtual memory • Performance degrades due to coarse-granularity Low Overhead Debugging with DISE – Marc Corliss
Multiple Watchpoints GCC For <4 watchpoints DISE/Inlined slightly worse DISE/Inlined much better for >3 watchpoints Low Overhead Debugging with DISE – Marc Corliss
Multiple Watchpoints GCC • For <4 DISE/B.F. slightly worse than Inlined • DISE/B.F. replacement sequence includes load • For >3 DISE/B.F. does the best • DISE/Inlined replacement sequence too large Low Overhead Debugging with DISE – Marc Corliss
Evaluation Results • DISE watchpoints have low overhead • DISE overhead usually less than 25% • In many cases DISE outperforms other approaches • Silent writes/conditionals spurious transitions • DISE flexibility helps keep low overhead in all scenarios • Overhead of instrumentation more consistent • Small cost on all writes rather than occasional large cost • Non-instrumentation has 1x to 100,000x slowdown Low Overhead Debugging with DISE – Marc Corliss
Related Work • iWatcher[Zhou et. al ‘04] • Hardware-assisted debugger • Associates program-specified functions with memory locations • Address-based versus instruction-based • Not general-purpose mechanism like DISE • More significant hardware modifications than DISE • Other related areas • Static transformation [Kessler ‘90, Wahbe et al. ‘93] • Instrumentation mechanisms [Valgrind, ATOM, EEL, Etch] Low Overhead Debugging with DISE – Marc Corliss
Conclusion • DISE effectively supports low overhead debugging • Virtues: general-purpose, flexible, simple-to-program, efficient, non-intrusive • Characterize interactive debugging implementations • Instrumentation has consistently low overhead Low Overhead Debugging with DISE – Marc Corliss