Download
1 / 15
150 likes | 293 Views
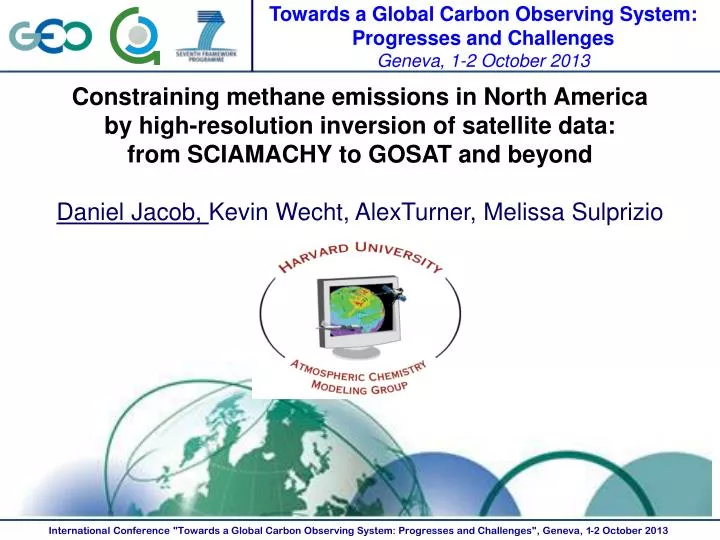
Towards a Global Carbon Observing System: Progresses and Challenges Geneva , 1-2 October 2013. Constraining methane emissions in North America by high-resolution inversion of satellite data: from SCIAMACHY to GOSAT and beyond

E N D
Towards a Global Carbon Observing System: Progresses and Challenges Geneva, 1-2 October 2013 Constraining methane emissions in North America by high-resolution inversion of satellite data: from SCIAMACHY to GOSAT and beyond Daniel Jacob, Kevin Wecht, AlexTurner, Melissa Sulprizio
Methane emission inventories for N. America: EDGAR 4.2 (anthropogenic), Kaplan (wetlands) N American totals in Tg a-1 Surface/aircraft observations in US suggest 2-3x underestimate of emissions
Methane observing system in North America Satellites AIRS, TES, IASI Thermal IR TROPOMI GCIRI (?) 1-day geo GOSAT 3-day, sparse SCIAMACHY 6-day Shortwave IR 2002 2006 2009 20015 2018 Suborbital 1/2ox2/3o grid of GEOS-Chem chemical transport model (CTM) INTEX-A SEAC4RS CalNex
Use GEOS-Chem CTM with observing system for optimized estimate of methane emissions Observations EDGAR 4.2 + Kaplan a priori bottom-up emissions GEOS-Chem CTM and its adjoint 1/2ox2/3o over N. America nested in 4ox5o global domain Bayesian inversion Validation Verification Optimized emissions at 1/2ox2/3o resolution
Testing GEOS-Chem methane background with HIPPO aircraft data across Pacific Aug-Sep11 Oct-Nov09 Jun-Jul11 Jan09 GEOS-Chem HIPPO Methane, ppbv Latitude, degrees Boundary conditions for N. American window are optimized as part of the inversion Alex Turner and Kevin Wecht, Harvard
Optimization of methane emissions using SCIAMACHY data for Jul-Aug 2004 Concurrent INTEX-A aircraft mission allows validation of SCIAMACHY, evaluation of inversion SCIAMACHY column methane mixing ratio XCH4 INTEX-A methane below 850 hPa C. Frankenberg (JPL) D. Blake (UC Irvine) XCH4 INTEX-A validation profiles H2O correction to SCIAMACHY data SCIAMACHY Kevin Wecht, Harvard INTEX-A
Optimization of state vector for adjoint inversion of SCIAMACHY data Optimal clustering of 1/2ox2/3ogridsquares Native resolution 1000 clusters 34 Optimized US anthropogenic emissions (Tg a-1) Correction factor to bottom-up emissions posterior cost function SCIAMACHY data cannot constrain emissions at 1/2ox2/3o resolution; use 1000 optimally selected clusters 28 Number of clusters in inversion 1 10 100 1000 10,000 Kevin Wecht, Harvard
N. American methane emission estimates optimized by SCIAMACHY data (Jul-Aug 2004) SCIAMACHY column methane mixing ratio Correction factors to priori emissions ppb 1700 1800 EDGAR v4.2 26.6 EPA 28.3 This work 32.7 US anthropogenic emissions (Tg a-1) Kevin Wecht, Harvard
GOSAT methane column mixing ratios, Oct 2009-2010 Retrieval from U. Leicester
Preliminary global adjoint inversion of GOSAT Oct 2009-2010 methane data Correction factors to prior emissions (EDGAR 4.2 + Kaplan) Nested adjoint inversion with 1/2ox2/3o resolution Alex Turner, Harvard
Testing information content of satellite data with CalNex inversion of methane emissions CalNex observations with GEOS-Chem prior Correction factors to EDGAR v4.2 May-Jun 2010 1800 2000 ppb 0.1 1 3 2x underestimate of livestock emissions Emisssions, Tg a-1 Kevin Wecht, Harvard
GOSAT observations are too sparse for spatial resolution of California emissions Correction factors to methane emissions from inversion GOSAT data (CalNex period)) GOSAT (CalNex period) GOSAT (1 year) Each point = 1-10 observations 0.5 1.5 Kevin Wecht, Harvard
Potential of TROPOMI and GCIRI for constraining methane emissions Correction factors to EDGAR v4.2 a priori emissions from a 1-year OSSE TROPOMI (global daily coverage) GCIRI (geostationary 1-h return coverage) 0.2 1 5 Kevin Wecht, Harvard
Working with stakeholders at the US state level State-by-state analysis of SCIAMACHY correction factors to bottom-up emissions with Iowa Dept. of Natural Resources State emissions computed w/EPA tools too low by x3.5; now investigating EPA livestock emission factors with New York Attorney General Office State-computed emissions too high by x0.6, reflects overestimate of gas/waste/landfill emissions Melissa Sulprizio and Kevin Wecht, Harvard
Policy-relevant recommendations for monitoring N American methane emissions • Need better understanding of methane emissions from livestock; these seem to be seriously underestimated in US EPA emission inventory • No apparent underestimate of methane emissions from oil/gas production, but careful monitoring is needed in view of industry expansion • TROPOMI (2015 launch) holds considerable promise for monitoring methane emissions; need to prepare inverse methods for exploiting the data • GCIRI (proposed geostationary launch in 2018/2019) would greatly augment capability for methane monitoring • Ground measurement sites play a critical role in evaluating satellite data; targeted aircraft campaigns can provide verification and better understanding of source regions