Download
1 / 2
20 likes | 162 Views
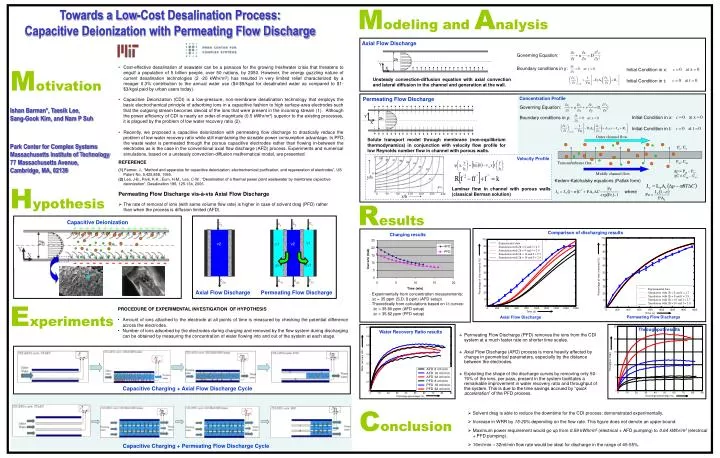
Outer channel flow. c. c. c. c. 1. 2. 1. 2. P o ; C o. v1. v2. v1. v2. Experimental data Simulation with 2h = 8 and f = 2.7 Simulation with 2h = 8 and f = 2.9 Simulation with 2h = 10 and f = 2.7 Simulation with 2h = 10 and f = 2.9. Experimental data

E N D
Outer channel flow c c c c 1 2 1 2 Po; Co v1 v2 v1 v2 Experimental data Simulation with 2h = 8 and f = 2.7 Simulation with 2h = 8 and f = 2.9 Simulation with 2h = 10 and f = 2.7 Simulation with 2h = 10 and f = 2.9 Experimental data Simulation with 2h = 8 and f = 2.7 Simulation with 2h = 8 and f = 2.9 Simulation with 2h = 10 and f = 2.7 Simulation with 2h = 10 and f = 2.9 2h Pm; Cm Transmembrane flux Y X Δv1 Δv1 Δv1 Dp = Pm – Po; DC = Cm – Co; Middle channel flow c c c c 0 1c 1c 2c 40 80 120 160 200 2a 240 Permeating Flow Discharge Concentration Profile Y 2h X 1 0.5 y/h 0 x/h Charging results Comparison of discharging results - Experimentally from concentration measurements: Dc = 35 ppm (S.D. 8 ppm) (AFD setup) - Theoretically from calculations based on I-t curves: Dc = 35.80 ppm (AFD setup) Dc = 35.82 ppm (PFD setup) Permeating Flow Discharge Axial Flow Discharge Modeling and Analysis Towards a Low-Cost Desalination Process: Capacitive Deionization with Permeating Flow Discharge Axial Flow Discharge Governing Equation: • Cost-effective desalination of seawater can be a panacea for the growing freshwater crisis that threatens to engulf a population of 5 billion people, over 50 nations, by 2050. However, the energy guzzling nature of current desalination technologies (2 -20 kWhr/m3) has resulted in very limited relief characterized by a meager 0.3% contribution to the annual water use ($4-$9/kgal for desalinated water as compared to $1-$3/kgal paid by urban users today). • Capacitive Deionization (CDI) is a low-pressure, non-membrane desalination technology that employs the basic electrochemical principle of adsorbing ions in a capacitive fashion to high surface-area electrodes such that the outgoing stream becomes devoid of the ions that were present in the incoming stream (1). Although the power efficiency of CDI is nearly an order-of-magnitude (0.5 kWhr/m3) superior to the existing processes, it is plagued by the problem of low water recovery ratio (2). • Recently, we proposed a capacitive deionization with permeating flow discharge to drastically reduce the problem of low water recovery ratio while still maintaining the sizeable power consumption advantage. In PFD, the waste water is permeated through the porous capacitive electrodes rather than flowing in-between the electrodes as is the case in the conventional axial flow discharge (AFD) process. Experiments and numerical simulations, based on a unsteady convection-diffusion mathematical model, are presented. • REFERENCE • (1) Farmer, J., “Method and apparatus for capacitive deionization, electrochemical purification, and regeneration of electrodes”, US Patent No. 5,425,858, 1995. • (2) Lee, J-B., Park, K-K., Eum, H-M., Lee, C-W., “Desalination of a thermal power plant wastewater by membrane capacitive deionization”, Desalination 196, 125-134, 2006. Motivation Boundary conditions in y: Initial Condition in x: Unsteady convection-diffusion equation with axial convection and lateral diffusion in the channel and generation at the wall. Initial Condition in t: Governing Equation: Ishan Barman*, Taesik Lee, Sang-Gook Kim, and Nam P Suh Initial Condition in x: Boundary conditions in y: Initial Condition in t: Solute transport model through membrane (non-equilibrium thermodynamics) in conjunction with velocity flow profile for low Reynolds number flow in channel with porous walls. Park Center for Complex Systems Massachusetts Institute of Technology77 Massachusetts Avenue, Cambridge, MA, 02139 Velocity Profile Kedem-Katchalsky equations (Patlak form) Hypothesis Laminar flow in channel with porous walls (classical Berman solution) where • Permeating Flow Discharge vis-à-vis Axial Flow Discharge • The rate of removal of ions (with same volume flow rate) is higher in case of solvent drag (PFD) rather than when the process is diffusion limited (AFD). Results Capacitive Deionization Axial Flow Discharge Permeating Flow Discharge Experiments • PROCEDURE OF EXPERIMENTAL INVESTIGATION OF HYPOTHESIS • Amount of ions attached to the electrode at all points of time is measured by checking the potential difference across the electrodes. • Number of ions adsorbed by the electrodes during charging and removed by the flow system during discharging can be obtained by measuring the concentration of water flowing into and out of the system at each stage. • Permeating Flow Discharge (PFD) removes the ions from the CDI system at a much faster rate on shorter time scales. • Axial Flow Discharge (AFD) process is more heavily affected by change in geometrical parameters, especially by the distance between the electrodes. • Exploiting the shape of the discharge curves by removing only 50-70% of the ions, per pass, present in the system facilitates a remarkable improvement in water recovery ratio and throughput of the system. This is due to the time savings accrued by “quick acceleration” of the PFD process. Throughput results Water Recovery Ratio results Capacitive Charging + Axial Flow Discharge Cycle Conclusion • Solvent drag is able to reduce the downtime for the CDI process: demonstrated experimentally. • Increase in WRR by 15-20% depending on the flow rate. This figure does not denote an upper bound. • Maximum power requirement would go up from 0.59 kWhr/m3 (electrical + AFD pumping) to 0.64 kWhr/m3 (electrical + PFD pumping). • 16ml/min – 32ml/min flow rate would be ideal for discharge in the range of 45-55%. Capacitive Charging + Permeating Flow Discharge Cycle
Permeating Flow Discharge (PFD) removes the ions from the CDI system at a much faster rate on shorter time scales.