Download
1 / 25
250 likes | 326 Views
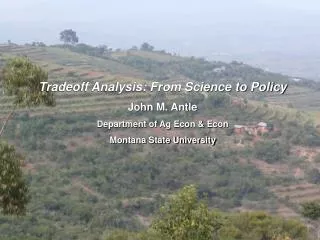
Tradeoff Analysis and Minimum-Data Modeling John Antle Jetse Stoorvogel. Workshop on Adaptation to Climate Change, Nairobi September 24-26 2008. The challenge: policy-relevant assessment of agricultural sustainability

E N D
Tradeoff Analysis and Minimum-Data Modeling John Antle Jetse Stoorvogel Workshop on Adaptation to Climate Change, Nairobi September 24-26 2008
The challenge: policy-relevant assessment of agricultural sustainability • How to quantify concept of sustainability to support informed policy decision making? • Identify stakeholder priorities (indicators) and strategies (scenarios) • Understand how indicators respond to changes in the system (tradeoffs and win-wins)
The Challenge: Support informed decision makingThe Approach: Tradeoff Analysis • Public stakeholders • Policy makers • Scientists
Indicators, tradeoffs and scenarios The Challenge: Support informed decision makingThe Approach: Tradeoff Analysis • Public stakeholders • Policy makers • Scientists
Indicators, tradeoffs and scenarios The Challenge: Support informed decision makingThe Approach: Tradeoff Analysis • Public stakeholders • Policy makers • Scientists • Identify key sustainability indicators and tradeoffs • Identify technology and policy scenarios
Indicators, tradeoffs and scenarios Coordinated Disciplinary Research The Challenge: Support informed decision makingThe Approach: Tradeoff Analysis • Public stakeholders • Policy makers • Scientists
Indicators, tradeoffs and scenarios Coordinated Disciplinary Research The Challenge: Support informed decision makingThe Approach: Tradeoff Analysis • Public stakeholders • Policy makers • Scientists • Identify key disciplines in research team • Define spatial and temporal scales of analysis for • disciplinary integration and policy analysis
Indicators, tradeoffs and scenarios Coordinated Disciplinary Research Communicate results to stakeholders The Challenge: Support informed decision makingThe Approach: Tradeoff Analysis • Public stakeholders • Policy makers • Scientists
Indicators, tradeoffs and scenarios Coordinated Disciplinary Research Communicate results to stakeholders The Challenge: Support informed decision makingThe Approach: Tradeoff Analysis A participatory process, not a model • Public stakeholders • Policy makers • Scientists
Implementing the TOA Approach: the TOA Software A modular approach to integrate spatial data and disciplinary models to simulate agricultural systems on a site-specific basis and aggregate to a level relevant for policy analysis.
Tradeoff Analysis: assessing technology & policy options • Tradeoff curves: feasible combinations of sustainability indicators • Technology and policy scenarios: using data and modeling tools to explore options and find win-win solutions. Health & Environment People may choose to trade off income for health or environmental quality, or vice-versa! Why not do BCA? Farm Income
Example: Using TOA for analysis of CC mitigation, impacts & adaptation in Machakos, Kenya • (Antle & Stoorvogel, Env & Dev Econ 2008) • climate models: data and downscaling of IPCC scenarios w/wo aerosols • crop and livestock models: suitability for CC analysis of impacts & adaptation • economic data and models: adaptation through changes in land use, management • environmental process models
semi-subsistence farming system, maize, vegetables, subsistence crops & livestock • serious soil nutrient & SOM depletion • more than 60% of households below poverty line ($1/day/person)
Main issues • Population pressure
Main issues Population pressure Land degradation
Main issues Population pressure Land degradation Climate (drought) • Low farm incomes • Low farm productivity • Low soil fertility
Climate change, poverty and nutrient depletion with maize price scenario
Climate change, poverty and nutrient depletion with vegetable price scenario
Towards the Minimum-Data Approach • TOA is one way to quantify the concept of agricultural sustainability • but data requirements are very high, models are complex • for some questions (e.g., technology adoption, ecosystem services) we can use simpler models with lower data requirements to obtain a first-order estimate of economic feasibility of new technologies
Comparison of EP and MD models: Carbon contract participation in Machakos, Kenya Case Study (Full model = 700 parms, MD = 75)
Plan for the Rest of the Workshop • Systems modeling: the Machakos case • Minimum-Data modeling: economics • Minimum-Data modeling: bio-physical • Minimum-Data software • Exercises • Improved maize variety • Climate change impacts • Sweet potato adoption • Adaptation to climate change • Project planning