Download
1 / 17
170 likes | 284 Views
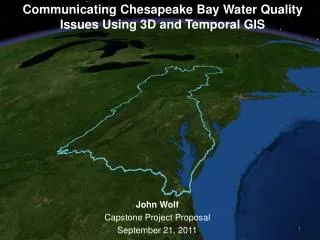
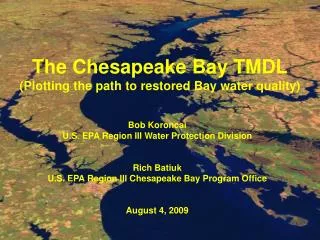
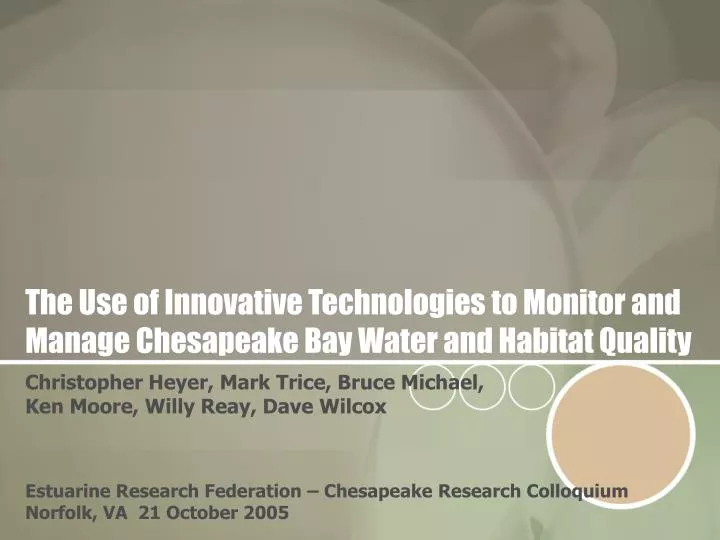
The Use of Innovative Technologies to Monitor and Manage Chesapeake Bay Water and Habitat Quality. Christopher Heyer, Mark Trice, Bruce Michael, Ken Moore, Willy Reay, Dave Wilcox Estuarine Research Federation – Chesapeake Research Colloquium Norfolk, VA 21 October 2005. Operational.

E N D
The Use of Innovative Technologies to Monitor and Manage Chesapeake Bay Water and Habitat Quality Christopher Heyer, Mark Trice, Bruce Michael,Ken Moore, Willy Reay, Dave Wilcox Estuarine Research Federation – Chesapeake Research Colloquium Norfolk, VA 21 October 2005
Operational • Special Projects Monitoring Components • Fixed Station Monitoring • Real-Time Monitoring Network • Water Quality Mapping • DataView • Sensor Testing • Vertical Profilers • Remote Sensing • CBOS • Event Triggered Sampling • Current Measurements • AUV
Continuous Monitoring • 39 stations statewide • Generally, deployed April - October • Hourly telemetry from 18 stations to website • Most meters set at 1-meter below surface • Measures water quality parameters every 15 minutes • Provides temporally intensive data during extreme events and other times it’s impractical to deploy field crews Dissolved Oxygen, Turbidity, Chlorophyll, Water Temperature,Salinity, pH
System Status and Alerts Telemetry Status Dissolved Oxygen & Chlorophyll Exceedances Equipment Malfunction
25ug/l Chl a Threshold Magothy River 06/27/01 90% Confidence Pass Fail Uncertain Water Quality Mapping • Data collected every 4 seconds • Speeds up to 25 knots • 3,500 - 15,000 data readings/day • Spatially explicit data are useful for delineating habitat conditions
Eyes on the Bay – Web Portal http://www.eyesonthebay.net
DATAFLOW Visualization Software New Real-Time Mapping (DATAVIEW)
95% Confidence A Threshold is Violated Uncertain 95% Confidence A Threshold is not Violated Benefits of DATAVIEW • Use existing GIS data (bathymetry, SAV coverage, past cruise tracks, past data, etc.) • Alert system for collecting samples or equipment malfunction • Delineate blooms, turbidity max zones, anoxia • Probability mapping which allows resampling to improve measurement certainty. • Ground-Truthing • SAV distribution • Remote sensing imagery
Sensor Testing • OpticalDissolved OxygenSensors • CyanobacteriaFluorescenceSensors
Vertical Profilers Electronics Package Battery Computer Controlled Winch
Remote Sensing mddnr.chesapeakebay.net/NASAimagery/EyesInTheSky.cfm
CBOS/HPL Dock www.eyesonthebay.net Near-real time data display Power source P H O S P H A T E N + N Water sampler Data Telemetry Data Logger MD DNR Urea / Ammonium Shore station antenna YSI 6600 HPL Shore station PC Event Triggered Sampling Work conducted by UMCES Horn Point Lab
AUV • Detecting Localized Changes in Water Quality Associated with Oyster and SAV Restoration Sites (Corsica River) • Mapping Water Quality in Tidal Creeks and Other VERY Shallow Areas • 3D Interpolation of Water Quality (AUV in Combination with DataFlow) • 3D Structure Algal Blooms
Acknowledgements Partners • A Super Team! • Maryland and Virginia • Field Operations • Staff, Faculty and Student Researchers • Data Managers