Download
1 / 20
220 likes | 474 Views
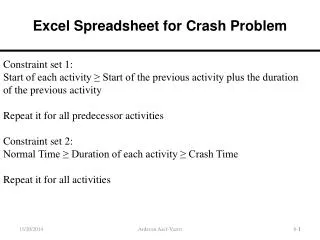
Excel Spreadsheet. Project 1. Objective:. Begin to see the possibilities of Excel How to gather and organize data Entering formula’s Convert data into graphs. Instructions:. We will be doing an overview of your class population and some of the characteristics that define it.

E N D
Excel Spreadsheet Project 1
Objective: • Begin to see the possibilities of Excel • How to gather and organize data • Entering formula’s • Convert data into graphs.
Instructions: • We will be doing an overview of your class population and some of the characteristics that define it. • How to read the cell locations • You will notice letters run from left to right, numbers from top to bottom.
Locating cells • We have located cells D5 and B11
How many Students? • In cell B1 we need to enter in the total number of students there are in the class • My example class has 14 students
What is everyone's age? • In cells B4 through G4 enter in the number of students that fit into each category. • For example I have two students that are 14 and three that are 15.
Checks and balance • Any good spreadsheet has a way to check yourself to ensure your data is correct. • If you look at the example below you will notice that I only have data for twelve students, my total number was fourteen so I am missing data on two students. • To the right is a field that lets you know how many more students you need to enter data on.
Fun Data • I thought you might be interested to know how many years the whole class is old if we added everyone together and what the average age is.
Graphs • Graphs are a great way for people to understand data visually. • Towards the bottom of the spreadsheet I have created a graph for the ages of the class, which will now represent the data you entered.
Gender of the class • Now we need to enter in how many males and females are in your class • My example class has 6 males and 8 females
The Check is broken • The formula for counting the number of students entered in the males and females is missing • We need to enter the formula, the data for both is in cells B11 and C11 so we need to add them together • Double click in the cell I11 and enter in this formula =(B11+C11) and hit enter
Hair Color • Lets enter the data for everyone's hair color. • Fill in cells B14 through F14
Another Formula • The formula for counting the students hair color is also missing • We need to add cells B14 through F14 • Lets let the worksheet do the work • Hit the home tab located at the top left
Formula Cont… • Click in the cell that we want the formula in I14 • Press the formula button, it’s located at the far right
Last steps • When you press the formula button it tries to guess what you may want to add, you will find it guesses correctly most of the time. • It should look like this:
Done • We are going to click in cell B14 and holding the left mouse button, highlight through cells F14 • Now hit enter and it will add the cells together
School Data • Last we will enter the data for the High Schools represented in class. • Once the data has been entered highlight all of it, as shown:
Add a Graph • Click the Insert tab located on the top bar:
Pie R Square • Now click the Pie chart and choose the first graph:
Place the Graph • Resize your graph a little smaller and move it towards the bottom of the page so it looks nice