Download
1 / 46
460 likes | 576 Views
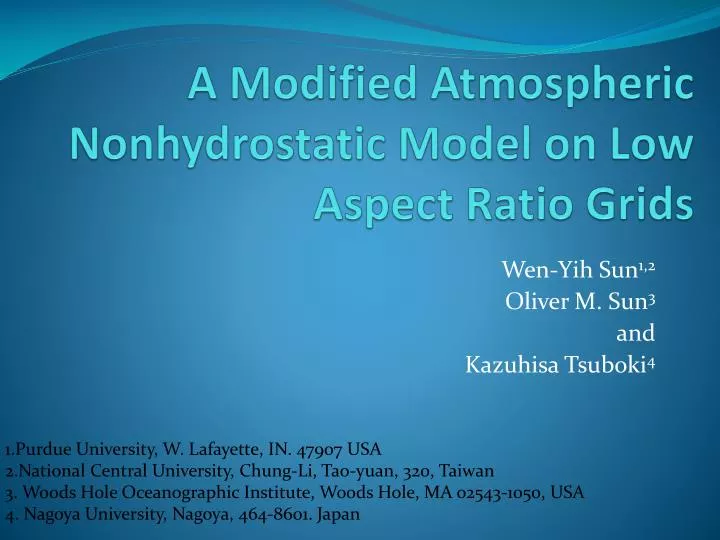
A Modified Atmospheric Nonhydrostatic Model on Low Aspect Ratio Grids. Wen- Yih Sun 1,2 Oliver M. Sun 3 and Kazuhisa Tsuboki 4. 1.Purdue University, W. Lafayette, IN. 47907 USA 2.National Central University, Chung-Li, Tao- yuan , 320, Taiwan

E N D
A Modified Atmospheric Nonhydrostatic Model on Low Aspect Ratio Grids Wen-Yih Sun1,2 Oliver M. Sun3 and Kazuhisa Tsuboki4 • 1.Purdue University, W. Lafayette, IN. 47907 USA • 2.National Central University, Chung-Li, Tao-yuan, 320, Taiwan • 3. Woods Hole Oceanographic Institute, Woods Hole, MA 02543-1050, USA • 4. Nagoya University, Nagoya, 464-8601. Japan
2. Basic Equations • (2.1) • (2.2) • (2.3) • (2.4) • (2.5) • (2.6)
Linearized Equations • (2.7) • (2.8) • (2.9) • (2.10) • (2.11)
The solutions of differential in time and difference in space are assumed: (semi-analytic= reference) We obtain the dispersive relationship: includes sound wave and internal gravity wave
Let define : If , It consists of the acoustic wave: and the gravity waves:
3. Eigenvalue of finite difference equations Modified Forward-backward
Finite Difference form for HE-VI (Horizontal Explicit-Vertical Implicit) , =1
(a) (b) Fig. 1: Frequency of gravity wave from FB with t=1.49s, g=10 m s-2, C=300m s-1, x=1000m, z=500m, and So=1.0-5m-1, (solid line) and (dash line); (b) and with t=2.98s; and (c) and with t=5.96s.
Fig. 2: (solid line) with t=1.179x10⁻² sx=z= 5m, and (dot line) is from -2.5x10⁻⁸ to 2.x10-9s-1 with contour interval of 5x10⁻⁹ s-1. (FB)
(a) (b) Fig. 3: (a) with x=1000m, z= 500m, t=2.98s; contour interval of (dash line) is 5x10⁻⁸s-1; (b) Same as (a) except x= z= 5m, t=1.179 x10⁻²s, contour interval of dot lines is 1x10⁻⁷s-1.
(a) (b) Fig. 4: (a): Initial x-component wind for Kelvin-Helmholtz instability (b) initial background (solid line) and perturbation ’ (color) for 4.1.
Fig. 5: (a): Simulated at t=320s with tb= 0.4s from (ts=0.01s, =0.01s, black), (ts=0.02s, green), (ts=0.04s, red), and (ts=0.02s, blue), contour interval is 0.5K;
(b) Fig. 6: (a) Initial background (black) and perturbation ’ (color) for 4.2-4.3;(b) Simulated ’ at t=240s from FB with =1 (black), =4 (green), =16 (red), and HE-VI scheme (blue) with ts=0.0025s, tb=0.1s, and x= z=5m. Contour interval is 0.005K.
Fig. 6: (a) Initial background (black) and perturbation ’ (color) for 4.2-4.3
Fig. 6(b) Simulated ’ at t=240s from FB with =1 (black), =4 (green), =16 (red), and HE-VI scheme (blue) with ts=0.0025s, tb=0.1s, and x= z=5m. Contour interval is 0.005K
Fig. 7: (a) Simulated ’ at t=240s from FB with =1, ts=0.005s (solid line); =4, ts=0.01s (long dash); and =16 ts=0.02s (short dash). Contour interval is 0.005K;
Fig. 7b: ’ from HE-VI with ts=0.005s (dot line) and ts=0.01s (solid line). Contour interval is 0.005K.
Initial condition for KH-wave, w(black, solid), Ub(red, dash), and (green. dot) Simulated Short KH-wave at t=240s, Forward-back(dts=.005,black, solid), Implicit (dts=.01s red, dash), Mod. Forward-B (dts=.01s blue. dot)
Simulated vertical velocity w Short KH-wave at t=240s, Forward-back(dts=.005,black, solid), Implicit (dts=.01s red, dash), Mod. Forward-B (dts=.01s blue. dot)
Simulated w Short KH-wave at t=480s, Forward-back(dts=.005,black, solid), Implicit (dts=.01s red, dash), Mod. Forward-B (dts=.01s blue. dot)
(a) Fig. 8 (a) Initial for FB with =1, ts = 0.008s, x= z=5m& tb= 0.12s. interval is 0.05K; (b) simulated and v at t=6 m; (c) t=12 m; (d) at t=18 min.
(d) Fig. 8: simulated velocity v and ’at (c) t=12 min; (d) at t=18 min.
(a) (b) Fig. 9: Simulated v and at t=18 min: (a) with =16, ts = 0.03s; (b) with HE-VI, ts = 0.008s;
(c) (d) (c)(ts = 0.03s)- (ts = 0.008s), contours from -0.03K to 0.06K with interval of 0.01K; (d) (ts = 0.008s)- (ts = 0.008s), contours from -0.3 to 0.2 with interval of 0.5K.
(a) Fig. 10: Simulated w at t=6000s with x= 400m, z=125m and tb=10s, (a) (ts = 0.25s, black); (ts= 0.5s, green); (ts= 1.0 s, red); and (ts= 1.0s, blue);
(b) (b) - (red) and - (blue), the contour interval is 0.02ms-1.
Table 1: Variation of change of the total mass with respect to its initial value as function of time for MFB (=16, ts= 0.04s) and HE-VI (ts= 0.02s).
5. Summary • Modified nonhydrostatic model (MNH) with (between 4 and 16) applied to the continuity equation can suppress the frequency of acoustic waves very effectively with insignificant impact on gravity waves, which enables to use a longer time step . • MNH is simple, in which many numerical schemes can be easily incorporated. • The eigenvalues and nonlinear model simulations of Kelvin-Helmholtz instability, mountain wave, and thermal bubble when FB is applied to MNH (i.e., MFB) show that MFB can reproduce the results of the original NH very accurately and efficiently. • It is also found that the simulations from the HE-VI are consistent with those from FB if the time interval ts is very small, or the time variation of horizontal gradient is not as important as the vertical gradient within ts. Otherwise, HE-VI simulations can depart from the FB significantly. • MFB can use a higher-order scheme in space to simulate LES, and turbulence, etc., which requires a fine-resolution in both horizontal and vertical directions.
Simulations of Lee vortices by WRF & NTU-Purdue Model NTU-Purdue Model use modified semi-implicit scheme with =4 discussed in (E) Model configuration and experiment design –idealized mountain Grid points : 600 x 600 x 50 in x, y, z directions dx = dy = 1 km dz ~ 300 m Free-slip lower boundary condition U = 4 m s-1 N2 = 10-4 s-2 Mountain peak = 2 km Half width lengths: 5 and 10 km (tilted by 30 degrees). Fr = V/Nh = 0.2
Surface streamlines after 10h NTU-Purdue WRF
Surface streamlines after 20h NTU-Purdue WRF x
Sea level pressure after 10h Interval 0.05 hPa Interval 5 Pa NTU-Purdue WRF
Sea level pressure after 20h Interval 5 Pa Interval 0.05 hPa NTU-Purdue WRF
Procedure • The Purdue/ NTU model was initialized with the El Paso 12Z sounding. • Model results are shown for 2 - 4 hours of model forecasts. • Also shown are Meso-g and WSMR Surface Atmosphere Measuring System (SAMS) wind and pressure observations, the White Sands Profiler and other data. • For 01-25-2004, both the model and observations show strong downslope winds, and a stationary wave train extending downwind from the mountains, and apparently a hydraulic jump. For 01-19-2004, both the model and observations show blocked flow in the lee of the Organ mountains and downslope flow to the north of the WSMR post area.
NTU/Purdue WSMR Model Domain 201 x 201 Grid @ 1km Dx, Dy
El Paso sounding for 12 Z January 25, 2004 Scorer Parameter } l = 3.5 x 10⁻⁴ } l = 5.7 x 10⁻⁴
Observed and Modeled WSMR Pressure Perturbations for 0800 January 25, 2004 Color Lines: Purdue/NTU NH Model Pressure Perturbations (pascals) 0 to -200 Dark Bold Numbers: Observed Pressure Perturbations -175* -139 -149 -103 -91 -111* 0* -27 Grid number west to east direction E
WSMR 10 m wind field 0800 January 25, 2004 Hydraulic Jump/ Trapped Lee Waves 201x201 grid 1km Grid spacing. This plot shows the central part of the model domain Wind Barbs: Purdue/NTU NH Model Dark Arrows: Observed Winds Color contours show the model terrain in m asl. Grid number west to east direction
WSMR 10 m wind field 0800 January 25, 2004 Hydraulic Jump/ Trapped Lee Waves Wind Vectors: WRF NH Model Red Arrows: Observed Winds 199x199 grid 1 km grid spacing. This plot shows the central part. Color contours show the model terrain in m asl
(a) wind inWhite Sands after 4-hr integration, (dx=dy=2km, and dz=300m). initial wind U= 5 m/s; (b) Streamline (white line) and virtual potential temperature (background shaded colors) at z=1.8km, warm color (red) indicates subsidence warming on the lee-side, and cold (blue) color adiabatic cooling on the windward side of the mountain.
0700-0800 + 0800-0900 # + # + # + # + # + # + # + # + # # # + # + # 0730 + + # 0800 + # + + # 0830 # + + 0900 vertical velocity m/sec WSMR Wind Profiler Vertical Velocities NTU/Purdue model vertical velocities (connected lines) Wind Profiling Radar observed vertical velocities (+ and # ) with 0.5 m/ sec error bars. The vertical scale is altitude in meters asl WSMR Profiler 21000 NTU/Purdue Model Vertical Velocities at 0730 0800 0830 0900 18000 15000 12000 9000 6000 Average terrain height upwind 3000 Elevation of Basin Floor
Conclusions * Both theory & models show that modified forward-backward scheme & semi-implicit scheme with =16 are accurate for short waves in nonhydrostatic equations. * For an the idealized mountain, the simulations from both models are similar at 10-hrs integration, but difference becomes significant after 20-hrs integration. It is also noticed that a stagnation exists at the windward side in the NTU-Purdue model but not in the WRF. * The WSMS simulations show in the lee of the Organ Mountains, the WRF simulated wind mainly comes from the South without the formation of lee-vortices on the lee side. On the other hand, the wind simulated from the NTU-Purdue model mainly descends from the Mountains and forms the lee-vortices, which are in good agreement with observations. The vertical wind profile from the NTU-Purdue is also consistent with the observed wind according to the ARL wind profiler.