Download
1 / 17
180 likes | 326 Views
Agile BI Delivering Intelligence Faster. Tim Smith. The 5 Use Cases You Need to Know About Informatica 9.5. Big Transaction Data. Big Interaction Data. Online Transaction Processing (OLTP) Oracle DB2 Britton-Lee Ingres Informix Sysbase SQL Server ….

E N D
Agile BIDelivering Intelligence Faster Tim Smith
The 5 Use Cases You Need to Know AboutInformatica 9.5 Big Transaction Data Big Interaction Data Online TransactionProcessing (OLTP) Oracle DB2 Britton-Lee Ingres Informix Sysbase SQL Server … Online Analytical Processing (OLAP) &DW Appliances Teradata Redbrick EssBase Sybase IQ Netezza Other Interaction Data Clickstreamimage/Text Scientific Genomoic/pharma Medical Medical/Device Sensors/meters RFID tags CDR/mobile… Greenplum DataAllegro Asterdata Vertica Paracell… Agile BI Proactive CustomerEngagement App Performance Social Media Data Facebook Twitter Linkedin Youtube… Cloud Salesforce.comConcurGoogle App EngineAmazon… Data Privacy Big Data Processing Big Data Analytics onHadoop
I Need a Single View of All Enterprise Data NOW BusinessIntelligence BusinessIntelligence BusinessIntelligence BusinessIntelligence BusinessIntelligence BusinessIntelligence BusinessIntelligence Social Warehouses NoSQL … Cloud Computing Unstructured NACHA SWIFT Partner Data Applications Databases HIPAA ETL SOA Hand Coding ESB/EAI EII
Today, it Takes too Long to Deliver New Critical Data or Reports to the Business… On average, how long does it take to add a new source of data to your data warehouse? On average, how long does it take to create a complex report or dashboard with about 20 dimensions, 12 measures, and 6 user access roles? 1 week 11% 2 weeks 7% 1 week 15% 3 weeks 7% 2 weeks 9% 1 month 22% 3 weeks 13% 2 months 20% 1 month 16% 3 months 14% 2 months 16% 4-6 months 12% 3 months 16% 6 months or more 7% 4-6 months 9% 6 months or more 5% On average, how long does it take to change a hierarchy (e.g. a new way of classifying products or organizing sales regions)? 1 week 25% 2 weeks 13% 3 weeks 8% 2011TDWI BI BENCHMARK REPORTOrganizational and Performance Metricsfor Business Intelligence Teams 1 month 25% 2 months 10% 3 months 6% 4-6 months 8% 6 months or more 4%
It takestoo long to explain requirements It takesmonths to changeaDW/add new critical data It takesmany iterations to get the right data/reports Changes break integrations & impact applications Directly accessing operational systems is not possible / ideal Why Does it Take So Long? Typical Data Integration Process a 1 Design Change Integrate Unit Test Validate Deploy 2 b 3 4 c 5 6 d Business is Involved Too Late IT Has a Huge Backlog As-Is Value Stream Map (LOT OF WAIT & WASTE) e
You Can’t Solve this in the BI Layer… Data Federation Here = No Reuse No Common Data Access Layer Need a Common Data Access Layer No Easy Way to Handle Change No Data Quality & No Data Consistency Unstructured Data Spread Marts EDW Applications Mainframe DATA MART
Agile Businesses Can’tWait 3-6Months to… • Identify new business opportunities • Easily up-sell/cross-sell to customers • Take business decisions on “current” data • Comply with changing regulations • Identify and correct problems • Respond to competitive threats
Solution Architecture DATAVIRTUALIZATION Rules LogicalData Object LogicalData Object Rules X MAP DATADISCOVERY DATAREPLICATION PROD
Source Target JMS Data ReplicationNon-Invasive Access to Operational Data Transactional Applications Operational Data Store
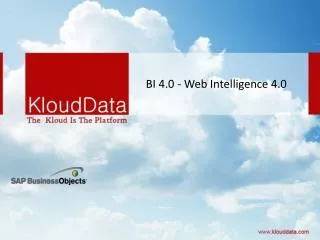
The Agile Enterprise Depends on XML Data Integration R H H R GS1 Web Services GDSN XML Partners Mobile Data Reporting Web Log Data
Big Transaction DataData Discovery Enterprise Domains Trustworthy Secure Labor Costs
00110101001001010101101010010110 Data VirtualizationFast and Direct Access to New Critical Data and Reports BI Composite Apps Portal Data Consumers CREATE A COMMON ACCESS LAYER ACROSS DATA SOURCES Data Virtualization (Built-On Lean Principles) QUICKLY & DIRECTLY ACCESS DATA WITHOUT MOVEMENT ORDER PRODUCT CUSTOMER … PROFILE AND CLEASE DATA SO IT CAN BE READILY TRUSTED Enterprise Data Sources DELIVER REUSABLE DATA SERVICES TO CONSUMERS Logical View of All Underlying Data
HealthNow Accelerates Value through Virtualization The Challenge. Business users had to wait 1700 hours for IT to make one small change in a report, so they created their own custom workarounds – 30,000 MS Access data marts • Rapidly prototype • Analyze & profile anytime • Transform & cleanse in real time • Provision to BI The Solution The Result 5x Faster 1/3rd Cost Business IT ChangeRequest Deploy toProduction Virtual View DW
Summary, Takeaways Have the Critical Conversation New data & reports take too long… “YOU” can now do it in DAYS! Business IT 1 Identify a Small, Critical BI Project in the Company Involve the Business Early & Often in the Process Bake-In Data Quality Demonstrate Business Value Early Self-Service + Data Virtualization = ROI 2 3 4 5
Deliver Intelligence FasterAgile BI Agil BI. Quickly deliver information to business users who wish to make trusted decisions in days instead of weeks or months. • Quickly Access New Data Sources: Data virtualization accelerates access to data sources while minimizing development time. • Trustworthy Data. Accelerates understanding of how good or bad data is without knowing its structure & identifies sensitive data to keep it private. • Simplifies Handling of Complex Data. XMap reduces time and cost required to process hierarchical data • Protects Production Systems. Data replication offloads data for analysis with minimal impact on production systems. The Solution The Result Deliver new intelligence to business in days instead of weeks or months VALUE Lower development costs to support BI/reporting COST
Next Steps Join the community at http://bit.ly/DataVisualizationCorner & Schedulea meeting with your Informatica representative now!