Download
1 / 5
50 likes | 169 Views
ZoomCharts is very excited to be part of the TechHub Rīga Meetup on March 12, 2015, taking place at Kaļķu street 12/14, Rīga, LV-1050, Latvia. ZoomCharts CEO and Co-Founder Janis Volbergs will be in attendance to talk about the startup path from idea, to market, to investment. Learn what it takes to build a product from the ground up and take it to a new level. TechHub Rīga is designed to bring together members of the Rīga startup community, to assist technology startups in starting up sooner, growing professional networks, collaborating, and having fun. Join the Meetup event to see Janis Volbergs’ presentation, take part in the Talent Pitch, or participate in the live Idea Pitch session. Supported by Latvian Guarantee Agency and Lattelecom, this event is free of charge and open to anyone who is interested. ZoomCharts is a leading data visualization provider, offering the world’s most interactive data visualization software. All charts and graphs are completely interactive, support big data sets, work on all modern devices including touch screens, and perform at unmatched high speeds. Be among the growing number of professionals discovering the exciting potential that ZoomCharts has in improving the efficiency of data analysis and presentation. Check out ZoomCharts products: Network Chart Big network exploration Explore linked data sets. Highlight relevant data with dynamic filters and visual styles. Incremental data loading. Exploration with focus nodes. Time Chart Time navigation and exploration tool Browse activity logs, select time ranges. Multiple data series and value axes. Switch between time units. Pie Chart Amazingly intuitive hierarchical data exploration Get quick overview of your data and drill down when necessary. All in a single easy to use chart. Facet Chart Scrollable bar chart with drill-down ZoomCharts http://www.zoomcharts.com The world’s most interactive data visualization software

E N D
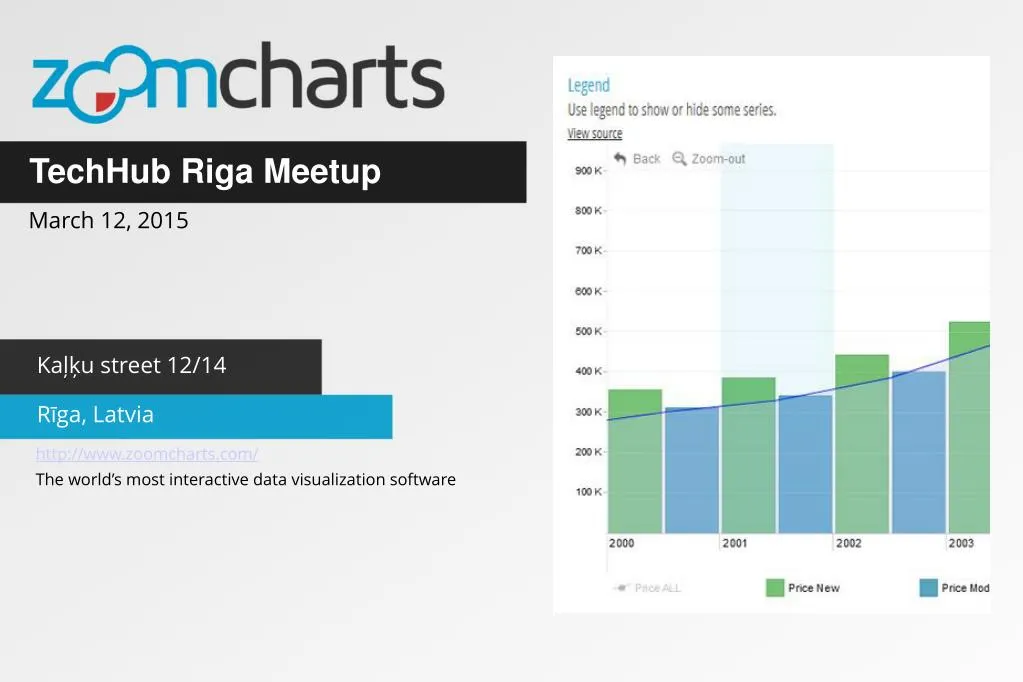
TechHub Riga Meetup March 12, 2015 Kaļķu street 12/14 Rīga, Latvia http://www.zoomcharts.com/ The world’s most interactive data visualization software
ZoomCharts at TechHub Riga Meetup March 12, 2015 ZoomCharts is very excited to be part of the TechHub Rīga Meetup on March 12, 2015, taking place at Kaļķu street 12/14, Rīga, LV-1050, Latvia. ZoomCharts CEO and Co-Founder Janis Volbergs will be in attendance to talk about the startup path from idea, to market, to investment. Learn what it takes to build a product from the ground up and take it to a new level. TechHub Rīga is designed to bring together members of the Rīga startup community, to assist technology startups in starting up sooner, growing professional networks, collaborating, and having fun.
ZoomCharts at TechHub Riga Meetup March 12, 2015 Join the Meetup event to see Janis Volbergs’ presentation, take part in the Talent Pitch, or participate in the live Idea Pitch session. Supported by Latvian Guarantee Agency and Lattelecom, this event is free of charge and open to anyone who is interested. ZoomCharts is a leading data visualization provider, offering the world’s most interactive data visualization software. All charts and graphs are completely interactive, support big data sets, work on all modern devices including touch screens, and perform at unmatched high speeds. Be among the growing number of professionals discovering the exciting potential that ZoomCharts has in improving the efficiency of data analysis and presentation.
ZoomCharts at TechHub Riga Meetup March 12, 2015
Check out ZoomCharts products: Network Chart Big network exploration Explore linked data sets. Highlight relevant data with dynamic filters and visual styles. Incremental data loading. Exploration with focus nodes. Time Chart Time navigation and exploration tool Browse activity logs, select time ranges. Multiple data series and value axes. Switch between time units. Pie Chart Amazingly intuitive hierarchical data exploration Get quick overview of your data and drill down when necessary. All in a single easy to use chart. Facet Chart Scrollable bar chart with drill-down Compare values side by side and provide easy access to the long tail. ZoomCharts http://www.zoomcharts.com/ The world’s most interactive data visualization software