Download
1 / 5
50 likes | 194 Views
ZoomCharts is offering data visualization tools to support presenters at the Fifth International Conference on Computer Science, Engineering and Applications (ICCSEA-2015), May 23rd to 24th in Delhi, India. Check out what you can do with ZoomCharts charts and graphs at http://zoomcharts.com ZoomCharts’ line of advanced data visualization software is fully interactive, supports massive amounts of data, works with all modern devices including touch screens, and does it all at an incredibly fast speed, unmatched by any other visualization software of its kind. These tools are being explored by a growing number of clients in a variety of fields as the best way to analyze and present data. Don’t be among the last to discover the exciting potential that ZoomCharts tools can open up for your data. Organized by AIRCC Publishing Corporation, an emerging peer reviewed, academic open access Computer Science and Engineering publisher, ICCSEA’s aim is to provide a platform for researchers and practitioners in academia and industry to gather and share cutting edge field developments. The conference will provide a forum for exploring significant contributions to major computer science and information technology fields, and to share knowledge and results in theory, methodology, and applications of computer science, engineering, and applications. ICCSEA is accepting authors’ original research paper submissions that illustrate research results, projects, surveying works, and industrial experiences describing significant advances in areas such as algorithms and bioinformatics. ZoomCharts http://www.zoomcharts.com The world’s most interactive data visualization software

E N D
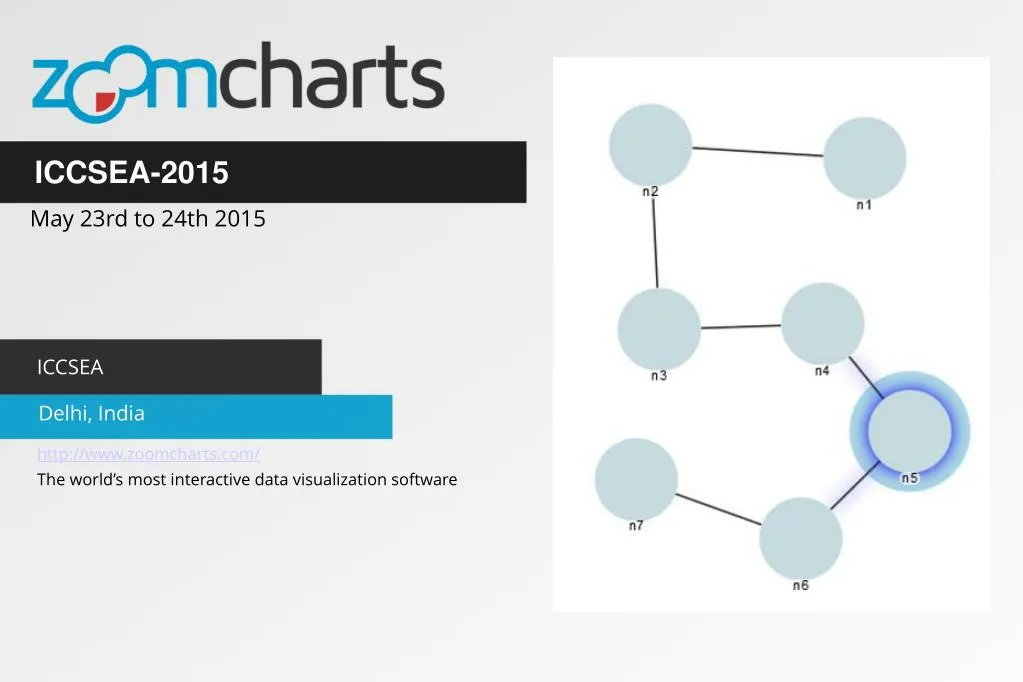
ICCSEA-2015 May 23rd to 24th 2015 ICCSEA Delhi, India http://www.zoomcharts.com/ The world’s most interactive data visualization software
ZoomCharts for ICCSEA-2015 May 23rd to 24th, 2015 ZoomCharts is offering data visualization tools to support presenters at the Fifth International Conference on Computer Science, Engineering and Applications (ICCSEA-2015), May 23rd to 24th in Delhi, India. Check out what you can do with ZoomCharts charts and graphs at http://zoomcharts.com ZoomCharts’ line of advanced data visualization software is fully interactive, supports massive amounts of data, works with all modern devices including touch screens, and does it all at an incredibly fast speed, unmatched by any other visualization software of its kind. These tools are being explored by a growing number of clients in a variety of fields as the best way to analyze and present data. Don’t be among the last to discover the exciting potential that ZoomCharts tools can open up for your data. Organized by AIRCC Publishing Corporation, an emerging peer reviewed, academic open access Computer Science and Engineering publisher, ICCSEA’s aim is to provide a platform for researchers and practitioners in academia and industry to gather and share cutting edge field developments. The conference will provide a forum for exploring significant contributions to major computer science and information technology fields, and to share knowledge and results in theory, methodology, and applications of computer science, engineering, and applications. https://zoomcharts.com/en/blog/zoomcharts-for-iccsea-2015
ZoomCharts for ICCSEA-2015 May 23rd to 24th, 2015 ICCSEA is accepting authors’ original research paper submissions that illustrate research results, projects, surveying works, and industrial experiences describing significant advances in areas such as algorithms and bioinformatics, computer architecture and real time systems, database and data mining, dependable, reliable, and autonomic computing, distributed and parallel systems and algorithms, DSP/image processing/pattern recognition/multimedia, embedded system and software, game and software engineering, geographical information systems/global navigation satellite systems (GIS/GNSS), grid and scalable computing, intelligent information and database systems, mobile and ubiquitous computing, modeling and simulation, multimedia systems and services, networking and communications, performance evaluation, programming languages, security and information assurance, soft computing (AI, neural networks, fuzzy systems, etc.), software engineering, web and Internet computing, theoretical computer science, natural language processing, operating systems, compiler design, and computer education.. https://zoomcharts.com/en/blog/zoomcharts-for-iccsea-2015
ZoomCharts For ICCSEA-2015 May 23rd to 24th
Check out ZoomCharts products: Network Chart Big network exploration Explore linked data sets. Highlight relevant data with dynamic filters and visual styles. Incremental data loading. Exploration with focus nodes. Time Chart Time navigation and exploration tool Browse activity logs, select time ranges. Multiple data series and value axes. Switch between time units. Pie Chart Amazingly intuitive hierarchical data exploration Get quick overview of your data and drill down when necessary. All in a single easy to use chart. Facet Chart Scrollable bar chart with drill-down Compare values side by side and provide easy access to the long tail. ZoomCharts http://www.zoomcharts.com/ The world’s most interactive data visualization software