Download
1 / 5
50 likes | 216 Views
ZoomCharts is offering data visualization tools to support speakers at the QCon New York conference, taking place June 10th through 12th, 2015, at the New York Marriott at the Brooklyn Bridge, 333 Adams Street, Brooklyn, NY 11201. Check out what you can do with ZoomCharts charts and graphs at http://zoomcharts.com ZoomCharts is the world’s most interactive data visualization software. All charts and graphs are 100% interactive, support big data, are mobile ready, and perform at incredibly fast speeds. Be among the growing number of professionals discovering the exciting potential that ZoomCharts has in bringing data presentation to the next level. QCon New York is a conference designed for technical team leads, architects, engineering directors, and project managers, which aims to empower software development by facilitating the spread of knowledge and innovation for developers. The event begins with two days of tutorials followed by two days of conferences. Conference topics include Java, software design, big data, applied data science, machine learning, hack prevention, emerging front end development technologies, and more. The QCon conference will feature over 100 speakers, including Brad Greenlee, Senior Software Engineer at Etsy; Matt Zimmer, Engineering Manager at Netflix’s Playback Data Systems; Marty Weiner, Engineer at Pinterest; Rowan Vasquez, Researcher at Twitter; Ryan McKillen, Head of NYC Software Engineering at Uber; Arian Adair, Production Engineer at Facebook, among many others.

E N D
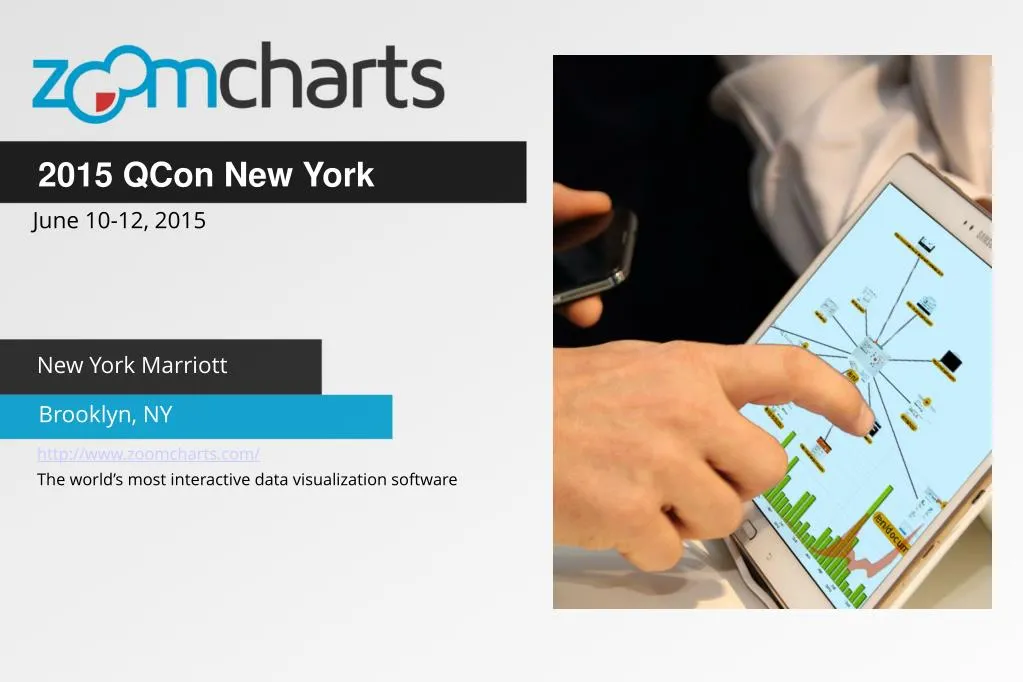
2015 QCon New York June 10-12, 2015 New York Marriott Brooklyn, NY http://www.zoomcharts.com/ The world’s most interactive data visualization software
2015 QCon New York June 10-12, 2015 ZoomCharts is offering data visualization tools to support speakers at the QCon New York conference, taking place June 10th through 12th, 2015, at the New York Marriott at the Brooklyn Bridge, 333 Adams Street, Brooklyn, NY 11201. Check out what you can do with ZoomCharts charts and graphs at http://zoomcharts.com ZoomCharts is the world’s most interactive data visualization software. All charts and graphs are 100% interactive, support big data, are mobile ready, and perform at incredibly fast speeds. Be among the growing number of professionals discovering the exciting potential that ZoomCharts has in bringing data presentation to the next level.
2015 QCon New York June 10-12, 2015 QCon New York is a conference designed for technical team leads, architects, engineering directors, and project managers, which aims to empower software development by facilitating the spread of knowledge and innovation for developers. The event begins with two days of tutorials followed by two days of conferences. Conference topics include Java, software design, big data, applied data science, machine learning, hack prevention, emerging front end development technologies, and more. The QCon conference will feature over 100 speakers, including Brad Greenlee, Senior Software Engineer at Etsy; Matt Zimmer, Engineering Manager at Netflix’s Playback Data Systems; Marty Weiner, Engineer at Pinterest; Rowan Vasquez, Researcher at Twitter; Ryan McKillen, Head of NYC Software Engineering at Uber; Arian Adair, Production Engineer at Facebook, among many others.
2015 QCon New York June 10-12, 2015
Check out ZoomCharts products: Network Chart Big network exploration Explore linked data sets. Highlight relevant data with dynamic filters and visual styles. Incremental data loading. Exploration with focus nodes. Time Chart Time navigation and exploration tool Browse activity logs, select time ranges. Multiple data series and value axes. Switch between time units. Pie Chart Amazingly intuitive hierarchical data exploration Get quick overview of your data and drill down when necessary. All in a single easy to use chart. Facet Chart Scrollable bar chart with drill-down Compare values side by side and provide easy access to the long tail. ZoomCharts http://www.zoomcharts.com/ The world’s most interactive data visualization software