Download
1 / 64
640 likes | 841 Views
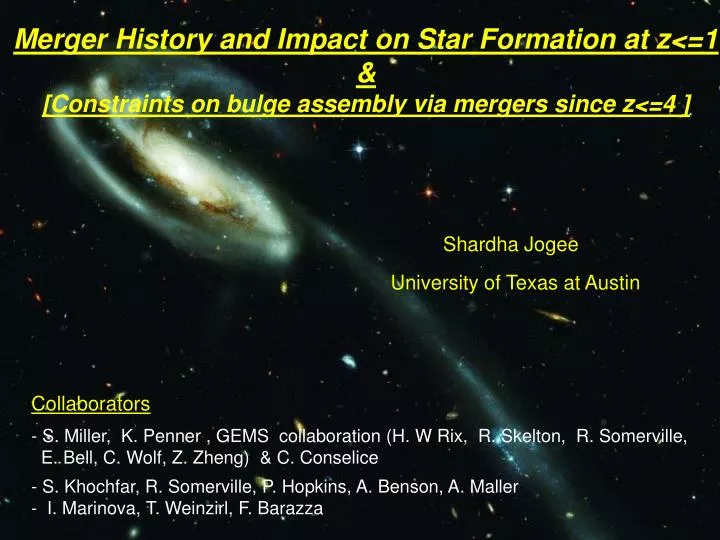
Merger History and Impact on Star Formation at z<=1 & [Constraints on bulge assembly via mergers since z<=4 ]. Shardha Jogee University of Texas at Austin. Collaborators - S. Miller, K. Penner , GEMS collaboration (H. W Rix, R. Skelton, R. Somerville,

E N D
Merger History and Impact on Star Formation at z<=1 & [Constraints on bulge assembly via mergers since z<=4 ] Shardha Jogee University of Texas at Austin Collaborators - S. Miller, K. Penner , GEMS collaboration (H. W Rix, R. Skelton, R. Somerville, E. Bell, C. Wolf, Z. Zheng) & C. Conselice - S. Khochfar, R. Somerville, P. Hopkins, A. Benson, A. Maller - I. Marinova, T. Weinzirl, F. Barazza
Merger History & Impact on Star Formation at z<=1 Jogee et al & GEMS team 2008, 2009 (arXiv:0810.5617) Goals What is relative importance of different galaxy assembly modes as f(z) : major mergers, minor mergers, cold gas accretion, secular mode 1) Provide empirical constraints on major + minor merger history out to z~1 2) Compare with predictions from LCDM-based models 3) By how much is <SFR> enhanced in normal vs visibly merging system? 4) What % of the SFR density comes from visibly merging galaxies ?
Ingredients - ACS F606W 0.1” images from GEMS (Rix et al 2004) - Spectro-photo z + stellar masses from COMBO-17 (Borch+06; Wolf+04) - UV and IR-based SFR from COMBO-17 & Spitzer (Bell et al 2007) - z ~ 0.2 to 0.8 (Tback~3 to 7 Gyr) - High mass (M/M0 >= 2.5x10¹⁰): Complete for red seq and blue cloud : N~800 galaxies - Interm. mass (M/M0 >= 1x10⁹): Complete for blue cloud only N~3700 galaxies
Methodology : identifying mergers • Method 1 • Visual classification of ~3700 galaxies by 3 classifiers • Identify systems (of M>Mcut) which show evidence of having experienced • a merger of mass ratio >1/10 in the last visibility timescale • Method 2 • Automated CAS criterion based on asymmetry A and clumpiness S • A> 0.35 and A >S
Visual classification of Interacting vs Non-Interacting systems Non-interacting E-Sd Non-Interacting Irr1 Galaxies with small –scale asymmetries that can be internally triggered (e.g., via stochastic SF or low V/s) without any galaxy-galaxy interactions. Mergers Systems with evidence (e.g., morphological distortions) indicative of a merger of M1/M2>1/10 in last t_vis. e.g., single remnants with tidal tails, warps, strongly asymmetric arms, double nuclei, galaxies bounded by a bridge, e.g. very close (d<< t_vis * v) pair of overlapping galaxies
Example of interacting systems 2 at similar z 2 at similar z
Separate mergers into major minor, major/minor Mergers Systems with evidence (e.g.,morphological distortions) indicative of a merger of M1/M2>1/10 in last t_vis. Clear Major (M1/M2>1/4) - Double nuclei same L - Contact pair w/ M1/M2>1/4 and z1~z2 - Train wreck Clear Minor (1/10 < M1/M2 <1/4) - Contact pair with M1/M2 ~1/4 to 1/10 and z1~z2 - Single system where disk has survived, but shows a warp or strong tidal signatures Ambiguous: Major or Minor % of minor or major % of clear majors % of clear minor
Test effect of bandpass shift and SB dimming on visual f • In last bin z =0.6--0.8 • - rest-frame l of GEMS V • image shifts to near-UV • (3700-3290 A) • - SB dimming by factor of 8 • Compare f from GEMS v vs deep, redder GOODS z • Results changes by less • than 1.07
Methodology : identifying mergers • Method 1 • Visual classification of ~3700 galaxies by 3 classifiers • Identify systems (of M>Mcut) which show evidence of having experienced • a merger of mass ratio >1/10 in the last visibility timescale • Method 2 • Automated CAS criterion based on asymmetry A and clumpiness S • A> 0.35 and A >S
Merger fraction from CAS vs visual classifications What are the visual types of the M*>1e9 systems picked by the CAS criterion (A>0.35 and A>S) ? 1) 44% (z~0.3) to 80% (z~0.7) are visually-classified non-interacting (Irr1, E-Sd) galaxies high contamination from non-interacting systems especially at z>0.5 2) the remaining are visually-classified merger systems [50% to 70% of latter are picked]
Mergers/interactions missed by the CAS criterion (A>0.35,A>S) Non-Interacting galaxies picked by CAS criterion (A>0.35,A>S)
Merger history of massive galaxies since z~0.8 (last 7 Gyr) For high mass (M>=2.5e10) galaxies Interaction fraction f (for mass ratio >1/10) ~ 8% to 9% fraction of clear major (M1/M2>=1/4) interactions ~1% to 3% fraction of clear minor (1:4 to 1/10) interactions ~ 4% to 8% fraction of ambiguous minor or major interactions ~ 1% to 2% For an assumed visibility time of 0.5 Gyr, this implies that over Tb=3-7 Gyr (z=0.2-0.8) , every massive galaxy has undergone 0.7 interactions of mass ratio >1/10, of which 1/4 are major mergers, 2/3 are minor mergers, and rest are major/minor. Jogee et al. & GEMS collaboration 2009
Compare merger rate of galaxies with LCDM models • Data • Rate= n f /Tvis for (major+minor) • Models • solid line = f(major + minor) • dotted lime = f_major • Models • - 3 SAMs w/ AGN feedback • - HOD w/ AGN feedback • - SPH cosmological For high mass galaxies,the (major + minor) merger rate of models - show factor of 5 dispersion - bracket the observed rate & show qualitative agreement Jogee et al. & GEMS collaboration 2009
Star formation over last 7 Gyr SFRUV ~ 0.1--25 Mo yr-1 Median (SFRIR/SFRUV) ~ 4 for 900 galaxies with both Spitzer and UV data significant obscured SF
<SFR> in Mergers vs Non-Interacting Galaxies over last 7 Gyr 3 measures of SFR 1) SFRUV from LUV of COMBO-17 for full sample [N= 3698] 2) SFRUV + SFRIR from Spitzer 24 mu, detected in only 24% of sample [N=878] 3) SFRUV + SFRIR-stacked from stacking 24 mu frame (Zheng et al 2007) for 87% of sample Mean SFR of visible mergers is enhanced only by a modest factor (~1.6 to 2) w.r.t that of non-interacting galaxies Similar results by Robaina et al. in prep (Jogee et al. & GEMS collaboration 2009)
(Di Matteo, P. et al. 2007) Statistical study of several hundred TREE-SPH simulations of major mergers of different B/D, gas, orbital parameters, etc They find max SFR of most mergers is only enhanced by ~2 to3, compared to isolated case
SFR density from mergers over last 7 Gyr For M*>=1e9 Mo & M*>=2.5e10 visible mergers account for less than 30% of the SFR density over z~0.2--0.8 (Tb=3 to 7 Gyr) • Decline in SFR density driven by shutdown in SF of normal galaxies • (Gas consumption by SF ? Decline in smooth gas accretion rate ? Transition of SF to lower masses ) (Jogee et al. & GEMS collaboration 2009)
Summary: Merger History & Impact on SF over 7 Gyr 1. Merger historyfor high mass (M>=2.5e10) galaxies - Fraction of mergers (of mass ratio >1/10) ~ 8% to 9% - For an assumed visibility time of 0.5 Gyr, this implies that over Tb=3-7 Gyr, every massive galaxy has undergone 0.7 interactions of mass ratio 1/10, of which 1/4 are major mergers, 2/3 are minor mergers, and rest are major/minor. 2. Visual vs automated CAS methods CAS merger criterion capture 50% to 70% of visually-classified mergers at z>0.5, has high contamination rate (80% at z~0.7) by non-interacting systems 3. Comparison with LCDM-based models For high mass galaxies, the (major + minor) merger rate of models show a factor of 5 dispersion and bracket the observed rate. Qualitative agreement 4. Impact on SF For both M*>=1e9 Mo and M*>=2.5e10 Mo, visible mergers - have their mean SFR enhanced by only ~1.6 to 2 wrt to non-interacting galaxies - account for less than 30% of the SFR density over z~0.2--0.8 (Tb=3 to 7 Gyr
Constraints on bulge assembly and merger history since z<4 Weinzirl, Jogee, Khochfar, Burkert & Kormendy 2009, ApJ, in press (arXiv:0807.0040) • Bulge + Disk+ Bar decomposition of H image of high mass (M*/M0 ~1010 -1011 ) spirals Most (66%) high mass spirals have low bulge B/T < 0.2 (77% have n<2) Such bulges exist in barred & unbarred galaxies across different H-types (S0-Sc).
Comparing with Hierarchical Models • Models from Khochfar & Burkert (2005) Khochfar & Silk 2006) • - DM halo merger trees from the extended Press-Schechter formalism • - Semi-analytic prescriptions for star formation (Cox+08) , cooling, SN feedback For Galaxies with a past major merger Major mergers at z<=2 lead to bulges with present- day B/T > 0.2 Also true for most major mergers at z<=4 (Weinzirl, Jogee, Khochfar, Burkert & Kormendy 2009)
Model vs data Present-day Data Model galaxies Model galaxies Model Galaxies B/T w/ major merger w/o major merger All since z<=4 since z <=4 ------------------------------------------------------------------------------------------------------------------ B/T <=0.266% ~1.6% ~66% ~68% 0.2 <B/T<= 0.4 26% ~5% ~13% ~18% B/T > 0.4 8% ~13% ~1 % ~14% • Major mergers since z<=4 fail seriously (by a factor of ~30) to account for the low B/T<0.2 bulges present in 2/3 of high mass spirals • It is likely that such bulges are primarily built by minor mergers • and secular processes at z<=4 (Weinzirl, Jogee, Khochfar, Burkert & Kormendy 2009)
Comparing with Hierarchical Models • Make a quantitative comparison with the predicted B/T distribution from CDM-based models (Khochfar & Burkert 2005; Khochfar & Silk 2006) • DM halo merger trees from the extended Press-Schechter formalism (Somerville & Kolatt 1999) • Baryonic physics from semi-analytic prescriptions for SF, cooling, supernovae feedbackMajor merger (M1/M21/4) dynamics: Major mergers set B/T to 1; B/T declines after major mergers due to disk buildup by cold accretion A galaxy with a past major merger can have B/T0.2 at z=0 only if zlast2 Galaxies with a past major merger Courtesy of Khochfar & Burkert
Distribution of B/T and Bulge Index • Mean B/T, bulge index are consistent with other work (e.g., Laurikainen et al. 2007; Graham & Worley 2008). • 68% of bulges have B/T0.2; 77% have n2 . Such bulges exist in barred and unbarred galaxies across a wide range in Hubble type! Weinzirl et al. 2008 Weinzirl et al. 2008
Distribution of B/T: Data vs Model • The fraction of model galaxies with a past major merger and B/T≤0.2 is 3%, more than 20 times smaller than the observed fraction (66%). • B/T≤0.2 bulges cannot have been built by major mergers! Weinzirl et al. 2008
Constraining Galaxy Evolution….. LCDM models: good paradigm for DM + structure on large scales • Predictions for galaxy evolution • = f (baryonic physics) • Possible areas of discord • Substructure or missing satellite problem • Angular momentum problem • Problem of bulgeless and low B/T galaxies (Springel et al. 2005) Need empirical constraints on baryonic ‘physics’ Merger history and its impact on SF part 1 of this talk Bulge properties as f (M) part 2 … Mechanisms redistributing angular momentum: mergers, bars Feedback (SF and AGN)
Merger fraction from visual classifications versus CAS • For high M/Mo>=2.5e10 • CAS-based f agrees within a factor of less than two with visual f • For interm M/Mo>=1e9 • CAS method overestimates f by a factor of 3 at z>0.5… as it picks up a large number of non-interacting galaxies (E-Sd and Irr1) Jogee et al 2008, 2009
Weinzirl et al. 2008 (ApJ submitted; arXiv:0807.0040) has two goals: Quantify B/T and bulge index for nearby high mass galaxies Make a detailed quantitative comparison with CDM-based models Motivation • Bulges provide important clues about galaxy formation, but the absence of bulges is likewise interesting! • Classical bulges are often absent locally: • 15% of edge-on galaxies are bulgeless (Kautsch et al. 2006) • 20% of i<60○ low-mass disks are quasi-bulgeless (Barazza, Jogee, & Marinova, 2008) • 11/19 galaxies with D<8 Mpc and Vc>150 km/s have pseudobulges (Kormendy & Fisher 2008) • Must compare distribution of bulge-to-total mass (B/T) and bulge index to CDM-based models for high and low masses Kautsch et al. 2006 Barazza, Jogee, Marinova (2008)
Main sample is 146 i < 70○ galaxies, complete for M* > 1010 M⊙ and MB < -19.3 Sample • Drawn from OSU Bright Spiral Galaxy Survey: • Bright local field galaxies with mB≤12 • Reference sample for bars in the local Universe (Eskridge 2000; Marinova & Jogee 2007) • Use H-band light to trace stellar mass
We perform 2D bulge-disk and bulge-disk-bar decomposition with GALFIT (Peng et al. 2002) Luminosity Decomposition • Galaxy light is emitted from physically and dynamically distinct components: • Most previous 2D decompositions have used only bulge-disk models (e.g., Allen et al. 2006) • Inclusion of the bar in 2D bulge-disk-bar decomposition is important: B/T and bulge index are overstated in 2D bulge-disk decomposition of barred galaxies (Laurikainen et al. 2005) 60% of galaxies are barred in H-band (Marinova & Jogee 2007) Optical bar fraction is higher in galaxies without prominent bulges (Odewahn 1996; Barazza, Jogee, Marinova 2008; Marinova et al. 2008; Aguerri et al. 2008)
Stage 1:One Component Input guesses for single Sersic component Fit single Sersic profile Stage 2:Two Components(bulge+disk or bar+disk) Stage 1 outputs are input guesses for bulge(disk b/a, PA fixed to pre-determined values) Fit Sersic profile + exponential disk Stage 3:Three Components(bulge+disk+bar) Stage 2 outputs areinput guesses for bulge and diskInclude guesses for bar parameters.(disk b/a, PA fixed to pre-determined values) Fit Sersic bulge + exponential disk + Sersic bar Choose the best fit from Stage 2 and Stage 3 based on: 2ResidualsModel parametersData image Decomposition With GALFIT • For 78% of galaxies, nuclear point sources were added to the best model(to account for AGN, HII nuclei, nuclear star clusters)
Stage 1:One Component Stage 2:Two Components(bulge+disk) Stage 3:Three Components(bulge+disk+bar) Sample Decomposition For NGC 4643 • B/T usually changes between Stage 2 and Stage 3 by a factor of <4 Residual bar light Weinzirl et al. 2008 Light redistributed from bulge & diskto bar ✓
Sample and Method Results
Distribution of B/T and Bulge Index • Mean B/T, bulge index are consistent with other work (e.g., Laurikainen et al. 2007; Graham & Worley 2008). • 68% of bulges have B/T0.2; 77% have n2 . Such bulges exist in barred and unbarred galaxies across a wide range in Hubble type! Weinzirl et al. 2008 Weinzirl et al. 2008
H-band bar fraction is greater by a factor of two for low B/T and low bulge index galaxies! Bar Fraction vs B/T and Bulge Index • H-band bar fraction is 58% (84/146), in agreement with other studies on the same data (Marinova & Jogee 2007; Laurikainen et al. 2004; Eskridge et. al 2000) • Is H-band bar fraction sensitive to B/T and bulge index? • Is there a relationship between bulges and bars? Secular evolution may build low-B/T, disky bulges Or, low-B/T galaxies with no ILR are more susceptible bars induced by swing amplification with a feedback loop (Julian & Toomre 1966; Toomre 1981; Binney & Tremaine 1987)
Comparing with Hierarchical Models • Make a quantitative comparison with the predicted B/T distribution from CDM-based models (Khochfar & Burkert 2005; Khochfar & Silk 2006) • DM halo merger trees from the extended Press-Schechter formalism (Somerville & Kolatt 1999) • Baryonic physics from semi-analytic prescriptions for SF, cooling, supernovae feedbackMajor merger (M1/M21/4) dynamics: Major mergers set B/T to 1; B/T declines after major mergers due to disk buildup by cold accretion A galaxy with a past major merger can have B/T0.2 at z=0 only if zlast2 Galaxies with a past major merger Courtesy of Khochfar & Burkert
Minor Mergers and Secular Evolution Contribution of minor mergers: Satellite deposits stars in central region of the primary Gas inflow from tidally induced bars and tidal torques Included in modelNeglected in model Contribution of secular evolution: Bar-driven inflow between mergers Boxy/peanut bulges from bar bending/buckling Minor mergers add all stellar mass in satellite to bulge of primarySecular processes are neglected • Bulge formation mechanisms include major mergers (M1/M21/4), minor mergers (1/10<M1/M2<1/4), and secular evolution
Distribution of B/T: Data vs Model • The fraction of model galaxies with a past major merger and B/T≤0.2 is 3%, more than 20 times smaller than the observed fraction (66%). • B/T≤0.2 bulges cannot have been built by major mergers! Weinzirl et al. 2008
Summary & Future Work • Sample: 146 i < 70○ galaxies; complete for M* > 1010 M⊙ and MB < -19.3 • Model: Hierarchical CDM-based models from Khochfar, Burkert, & Silk • Results: Low B/T0.2 bulges are found in 68% of spirals; n2 bulges are found in 77% Fraction of model galaxies with past major mergers at z<=4 and B/T<0.2 is more than 20 times smaller than the observed fraction • Future observational work: Measure ages of bulges relative to bars and disks with IFU spectroscopy • Ongoing decomposition of the dense Coma cluster (ACS Coma Cluster Treasury Survey; Carter et al. 2008) • Study properties of massive disks at 1.5<z<3 from the GOODS NICMOS survey (Conselice et al. 2008)
M/L Ratio • Backup slide of Schneider plot for M/L ratio and stellar populations • Bell equation for stellar mass+photometric vs dynamical mass + definitions
Swing Amplifier • Diagram of swing amplifier loop. Destruction of ILR
Stellar Masses • Bell equation for stellar mass+photometric vs dynamical mass + definitions