Download
1 / 37
380 likes | 439 Views
About 3FOLD<br><br>• Established in 2008<br>• Branches in Abu Dhabi, Dubai and Doha<br>• Approved by KHDA, PMI, AACE, ASQ, IMA and AACE<br>• The most economical institute for the official ASQ trainings<br>in UAE

E N D
The 7 Basic Tools of Quality (Ishikawa Tools of Quality) FREE Professional Development Seminar Series PMI, PMP, PMBOK and the PMI Registered Education Provider logo are registered marks of the Project Management Institute, Inc. © 2016 3FOLD Education Centre . All rights reserved . online@3foldtraining.com . www.3foldtraining.com . 800 3FOLD
At the end of the class, please fill the training feedback form! (Yellow paper in your notebook) Return the feedback form at the reception! © 2016 3FOLD Education Centre . All rights reserved . online@3foldtraining.com . www.3foldtraining.com . 800 3FOLD
Agenda • About 3FOLD • What is the seven basic tools of quality? • Tools • Q&A • Certificate Collection © 2016 3FOLD Education Centre . All rights reserved . online@3foldtraining.com . www.3foldtraining.com . 800 3FOLD
About 3FOLD • Established in 2008 • Branches in Abu Dhabi, Dubai and Doha • Approved by KHDA, PMI, AACE, ASQ, IMA and AACE • The most economical institute for the official ASQ trainings in UAE © 2016 3FOLD Education Centre . All rights reserved . online@3foldtraining.com . www.3foldtraining.com . 800 3FOLD
Why Do This? Improve Quality Decrease Costs Improve Productivity Decrease Price Increase Market Stay in Business Provide More Jobs Return on Investment © 2016 3FOLD Education Centre . All rights reserved . online@3foldtraining.com . www.3foldtraining.com . 800 3FOLD
PROBLEM SOLVING STEPS • Identify – recognize the symptoms • Define – Agree on the problem and set boundaries • Investigate – Collect data • Analyze – Use quality tools to aid • Solve – Develop the solution and implement • Confirm – Follow up to ensure that the solution is effective © 2016 3FOLD Education Centre . All rights reserved . online@3foldtraining.com . www.3foldtraining.com . 800 3FOLD
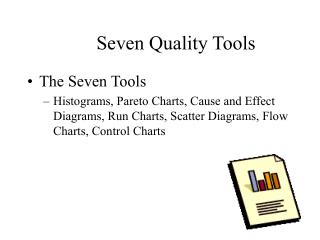
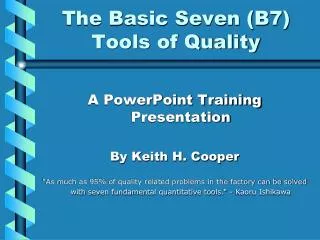
What is it? • The Seven Basic Tools of Quality is a designation given to a fixed set of graphical techniques identified as being most helpful in troubleshooting issues related to quality. • They are called basic because they are suitable for people with little formal training in statistics and because they can be used to solve the vast majority of quality-related issues. © 2016 3FOLD Education Centre . All rights reserved . online@3foldtraining.com . www.3foldtraining.com . 800 3FOLD
1. Cause and Effect Diagram • Use a cause-and-effect (fishbone or Ishikawa) diagram to organize brainstorming information about potential causes of a problem. • Diagramming helps you to see relationships among potential causes. • You can draw a blank diagram, or a diagram filled in as much as you like, including sub-branches. • Although there is no "correct" way to construct a fishbone diagram, some types lend themselves well to many different situations. © 2016 3FOLD Education Centre . All rights reserved . online@3foldtraining.com . www.3foldtraining.com . 800 3FOLD
Example • Using a Pareto chart, you discovered that your parts were rejected most often due to surface flaws. This afternoon, you are meeting with members of various departments to brainstorm potential causes for these flaws. Beforehand, you decide to print a cause-and-effect (fishbone) diagram to help organize your notes during the meeting. The example below illustrates how to generate a complete cause-and-effect diagram with sub-branches. © 2016 3FOLD Education Centre . All rights reserved . online@3foldtraining.com . www.3foldtraining.com . 800 3FOLD
Example © 2016 3FOLD Education Centre . All rights reserved . online@3foldtraining.com . www.3foldtraining.com . 800 3FOLD
2. Check Sheet • Description – A check sheet is a structured, prepared form for collecting and analyzing data. This is a generic tool that can be adapted for a wide variety of purposes. • When to Use – When data can be observed and collected repeatedly by the same person or at the same location, and . . . – When collecting data on the frequency or patterns of events, problems, defects, defect location, defect causes, and so forth, or . . . – When collecting data from a production process © 2016 3FOLD Education Centre . All rights reserved . online@3foldtraining.com . www.3foldtraining.com . 800 3FOLD
2. Check Sheet (Procedures) 1. Decide what event or problem will be observed. Develop operational definitions. Decide when data will be collected and for how long. Design the form. Set it up so that data can be recorded simply by making check marks or Xs or similar symbols and so that data does not have to be recopied for analysis. Label all spaces on the form. Test the check sheet for a short trial period to be sure it collects the appropriate data and is easy to use. Each time the targeted event or problem occurs, record data on the check sheet. 2. 3. 4. 5. 6. © 2016 3FOLD Education Centre . All rights reserved . online@3foldtraining.com . www.3foldtraining.com . 800 3FOLD
Example • The below figure shows a check sheet used to collect data on telephone interruptions. The tick marks ?ere added as data ?as collected o?er se?eral ?eeks’ time. What days are worst for interruptions? Which interruptions are most frequent? This check sheet was designed in the same format as a contingency table, so that the data can be analyzed with chi-square hypothesis tests without recopying into a different format. © 2016 3FOLD Education Centre . All rights reserved . online@3foldtraining.com . www.3foldtraining.com . 800 3FOLD
3. Histogram • Use to examine the shape and spread of sample data. Histograms divide sample values into many intervals called bins . Bars represent the number of observations falling within each bin (its frequency). © 2016 3FOLD Education Centre . All rights reserved . online@3foldtraining.com . www.3foldtraining.com . 800 3FOLD
Histogram (Cont…) • In the histogram below, for example, there are two observations with values between 2.5 and 7.5, three observations with values between 7.5 and 12.5, and so on. © 2016 3FOLD Education Centre . All rights reserved . online@3foldtraining.com . www.3foldtraining.com . 800 3FOLD
Histogram Example (Minitab) • You work for a shampoo manufacturer and need to ensure that the caps on your bottles are being fastened properly. If fastened too loosely, they may fall off during shipping. If fastened too tightly, they may be hard for you customers to open (especially in the shower). • You collect a random sample of bottles and test the amount of torque required to remove the caps. Create a histogram with a fitted normal distribution to evaluate how close your samples were to the target value of 18 and whether the data are distributed normally. © 2016 3FOLD Education Centre . All rights reserved . online@3foldtraining.com . www.3foldtraining.com . 800 3FOLD
Output Interpreting the results Mean torque for the sample was 21.26, slightly more than the target value of 18. Only one cap was very loose, with a torque of less than 11. However, the distribution is positively skewed and several caps were much tighter than they should be. Many caps required a torque of greater than 24 to remove and five caps required a torque of greater than 33, nearly two times the target value. Because the sample data are so skewed, the normal distribution does not fit very well. © 2016 3FOLD Education Centre . All rights reserved . online@3foldtraining.com . www.3foldtraining.com . 800 3FOLD
4. Pareto Chart • A Pareto chart is a bar graph. The lengths of the bars represent frequency or cost (time or money), and are arranged with longest bars on the left and the shortest to the right. In this way the chart visually depicts which situations are more significant. © 2016 3FOLD Education Centre . All rights reserved . online@3foldtraining.com . www.3foldtraining.com . 800 3FOLD
When to Use a Pareto Chart • When analyzing data about the frequency of problems or causes in a process. • When there are many problems or causes and you want to focus on the most significant. • When analyzing broad causes by looking at their specific components. • When communicating with others about your data. © 2016 3FOLD Education Centre . All rights reserved . online@3foldtraining.com . www.3foldtraining.com . 800 3FOLD
Minitab Example • Suppose you work for a company that manufactures motorcycles. You hope to reduce quality costs arising from defective speedometers. • During inspection, a certain number of speedometers are rejected, and the types of defects recorded. You enter the name of each defect into a worksheet column called Defects, and the corresponding counts into a column called Counts. • You know that you can save the most money by focusing on the defects responsible for most of the rejections. A Pareto chart will help you identify which defects are causing most of your problems. © 2016 3FOLD Education Centre . All rights reserved . online@3foldtraining.com . www.3foldtraining.com . 800 3FOLD
© 2016 3FOLD Education Centre . All rights reserved . online@3foldtraining.com . www.3foldtraining.com . 800 3FOLD
5. Scatter Diagram • The scatter diagram graphs pairs of numerical data, with one variable on each axis, to look for a relationship between them. If the variables are correlated, the points will fall along a line or curve. The better the correlation, the tighter the points will hug the line. © 2016 3FOLD Education Centre . All rights reserved . online@3foldtraining.com . www.3foldtraining.com . 800 3FOLD
When to Use a Scatter Diagram • When you have paired numerical data. • When your dependent variable may have multiple values for each value of your independent variable. • When trying to determine whether the two variables are related, such as… – When trying to identify potential root causes of problems. – After brainstorming causes and effects using a fishbone diagram, to determine objectively whether a particular cause and effect are related. – When determining whether two effects that appear to be related both occur with the same cause. – When testing for autocorrelation before constructing a control chart. © 2016 3FOLD Education Centre . All rights reserved . online@3foldtraining.com . www.3foldtraining.com . 800 3FOLD
Minitab Example • You are interested in how well your company's camera batteries are meeting customers' needs. Market research shows that customers become annoyed if they have to wait longer than 5.25 seconds between flashes. • You collect a sample of batteries that have been in use for varying amounts of time and measure the voltage remaining in each battery immediately after a flash (VoltsAfter), as well as the length of time required for the battery to be able to flash again (flash recovery time, FlashRecov). Create a scatterplot to examine the results. Include a reference line at the critical flash recovery time of 5.25 seconds. © 2016 3FOLD Education Centre . All rights reserved . online@3foldtraining.com . www.3foldtraining.com . 800 3FOLD
Interpreting the results As expected, the lower the voltage in a battery after a flash, the longer the flash recovery time tends to be. The reference line helps to illustrate that there were many flash recovery times greater than 5.25 seconds © 2016 3FOLD Education Centre . All rights reserved . online@3foldtraining.com . www.3foldtraining.com . 800 3FOLD
6. Flowchart • Flowcharts are used in designing and documenting simple processes or programs. Like other types of diagrams, they help visualize what is going on and thereby help understand a process, and perhaps also find flaws, bottlenecks, and other less-obvious features within it. © 2016 3FOLD Education Centre . All rights reserved . online@3foldtraining.com . www.3foldtraining.com . 800 3FOLD
Flowchart Helps understand the steps and sequence of steps to any process Load files Audit files Credit Send memo Distribute © 2016 3FOLD Education Centre . All rights reserved . online@3foldtraining.com . www.3foldtraining.com . 800 3FOLD
7. Control Charts • The control chart is a graph used to study how a process changes over time. Data are plotted in time order. • A control chart always has a central line for the average, an upper line for the upper control limit and a lower line for the lower control limit. These lines are determined from historical data. • By comparing current data to these lines, you can draw conclusions about whether the process variation is consistent (in control) or is unpredictable (out of control, affected by special causes of variation). © 2016 3FOLD Education Centre . All rights reserved . online@3foldtraining.com . www.3foldtraining.com . 800 3FOLD
Choosing a Control Chart © 2016 3FOLD Education Centre . All rights reserved . online@3foldtraining.com . www.3foldtraining.com . 800 3FOLD
Control Charts – Variable Data • Variables control charts for subgroups plot statistics from continuous measurement data , such as length or pressure, for subgroup data. • Variables control charts for individuals, time-weighted charts , and multivariate charts also plot measurement data. • Attributes control charts plot count data, such as the number of defects or defective units . © 2016 3FOLD Education Centre . All rights reserved . online@3foldtraining.com . www.3foldtraining.com . 800 3FOLD
X-bar and S Chart - Example • You work at an automobile engine assembly plant. One of the parts, a camshaft, must be 600 mm +2 mm long to meet engineering specifications. • There has been a chronic problem with camshaft length being out of specification, which causes poor-fitting assemblies, resulting in high scrap and rework rates. • Your supervisor wants to run X and R charts to monitor this characteristic, so for a month, you collect a total of 100 observations (20 samples of 5 camshafts each) from all the camshafts used at the plant, and 100 observations from each of your suppliers. First you will look at camshafts produced by Supplier 2. © 2016 3FOLD Education Centre . All rights reserved . online@3foldtraining.com . www.3foldtraining.com . 800 3FOLD
Xbar-R Chart of Supp2 Interpreting the results The center line on the X chart is at 600.23, implying that your process is falling within the specification limits, but two of the points fall outside the control limits, implying an unstable process. The center line on the R chart, 3.72, is also quite large considering the maximum allowable variation is +2 mm. There may be excess variability in your process. 1 1 UCL=602.376 602 Sample Mean __ X=600.23 600 LCL=598.084 598 1 3 5 7 9 11 13 15 17 19 Sample 8 UCL=7.866 6 Sample Range _ R=3.72 4 2 0 LCL=0 1 3 5 7 9 11 13 15 17 19 Sample © 2016 3FOLD Education Centre . All rights reserved . online@3foldtraining.com . www.3foldtraining.com . 800 3FOLD
Control Charts – Attribute Data • Attributes control charts are similar in structure to variables control charts, except that they plot statistics from count data rather than measurement data. • For instance, products may be compared against a standard and classified as either being defective or not. Products may also be classified by their number of defects . © 2016 3FOLD Education Centre . All rights reserved . online@3foldtraining.com . www.3foldtraining.com . 800 3FOLD
Minitab Example • You work in a toy manufacturing company and your job is to inspect the number of defective bicycle tires. You inspect 200 samples in each lot and then decide to create an NP chart to monitor the number of defectives. © 2016 3FOLD Education Centre . All rights reserved . online@3foldtraining.com . www.3foldtraining.com . 800 3FOLD
Interpreting the results Inspection lots 9 and 20 fall above the upper control limit, indicating that special causes may have affected the number of defectives for these lots. You should investigate what special causes may have influenced the out-of- control number of bicycle tire defectives for inspection lots 9 and 20. NP Chart of Rejects 30 1 1 25 UCL=20.10 20 Sample Count 15 __ NP=10.6 10 5 LCL=1.10 0 1 4 7 10 13 16 19 22 25 28 Sample © 2016 3FOLD Education Centre . All rights reserved . online@3foldtraining.com . www.3foldtraining.com . 800 3FOLD
Q & A ANY QUESTIONS ? © 2016 3FOLD Education Centre . All rights reserved . online@3foldtraining.com . www.3foldtraining.com . 800 3FOLD
END OF SEMINAR Please Fill the FEEDBACK FORM and RETURN IT to the RECEPTION. © 2016 3FOLD Education Centre . All rights reserved . online@3foldtraining.com . www.3foldtraining.com . 800 3FOLD


![Seven Quality Tools [Statistical Process Control]](https://cdn3.slideserve.com/6416179/seven-quality-tools-statistical-process-control-dt.jpg)