Download
1 / 4
0 likes | 67 Views
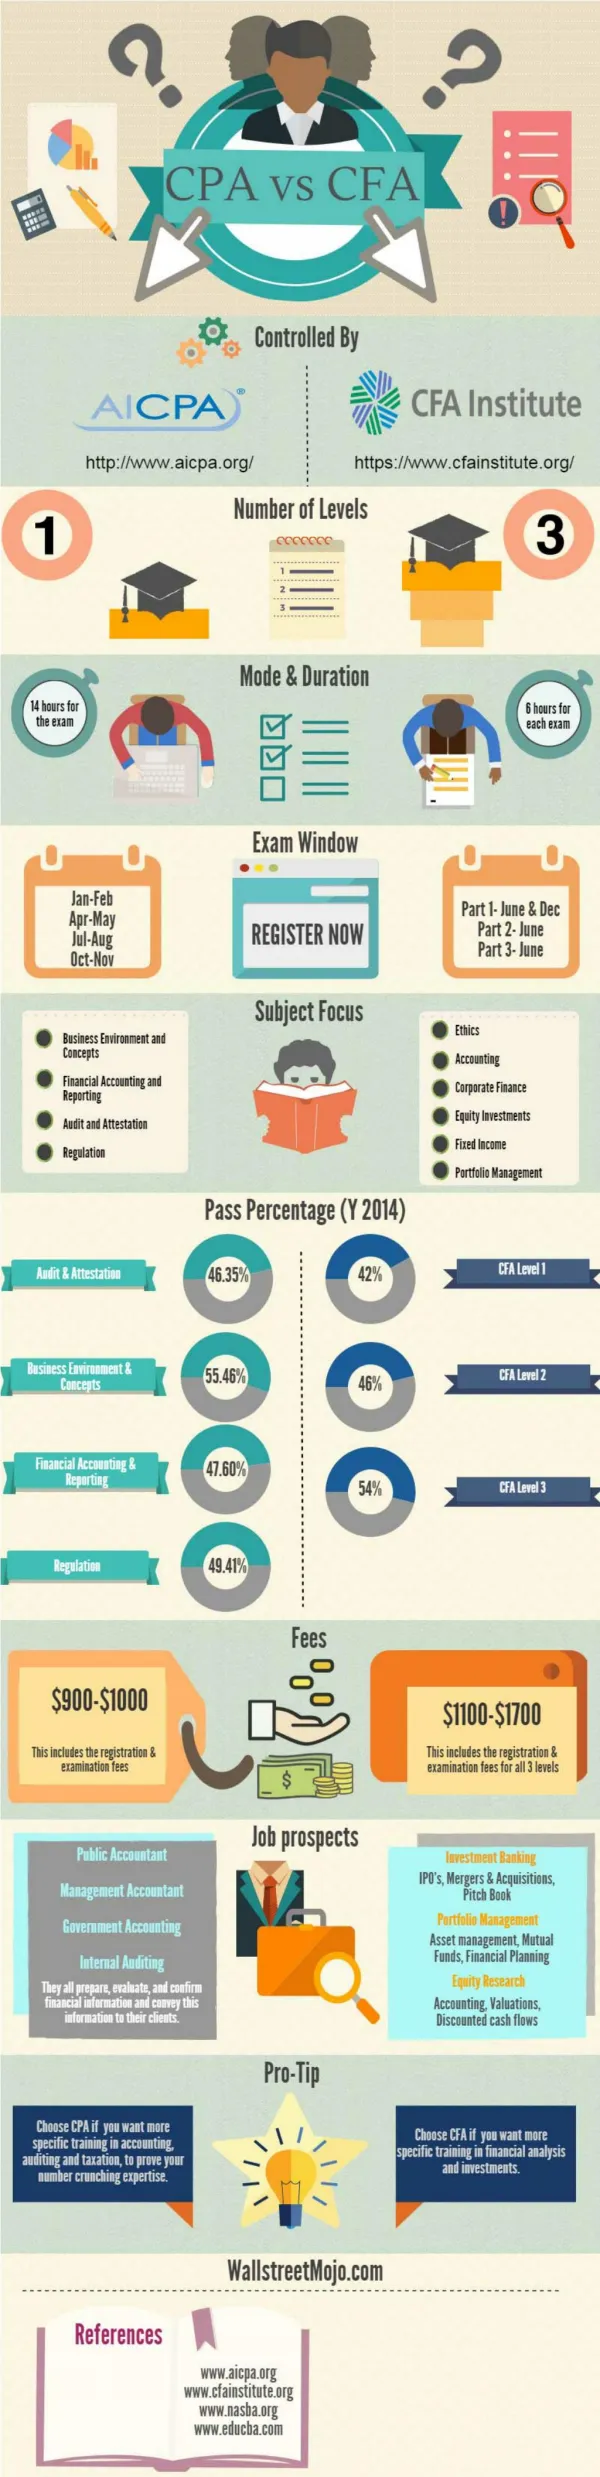
Choosing the right BI platform is crucial for effective data analysis and reporting. When evaluating Power BI and Tableau, key factors to consider include.<br><br>Keep reading as we explore each of these factors in detail and compare the Power BI consulting company and Tableau head-to-head.

E N D
Which Business Intelligence Tool is Better: Power BI vs Tableau? Choosing the right BI platform is crucial for effective data analysis and reporting. When evaluating Power BI and Tableau, key factors to consider include: ●Ease of use - How intuitive is the interface for users of all skill levels? ●Data connectivity - How many data sources can you connect to and how easy is it to connect them? ●Visualization options - What types of charts, graphs, and visuals can you create? ●Sharing and collaboration - How easy is it to share dashboards and reports with others? ●Scalability - Can the platform support large complex datasets and many users? ●Cost - What is the pricing model and how does it fit with your budget? Keep reading as we explore each of these factors in detail and compare the Power BI consulting company and Tableau head-to-head.
Ease of Use Power BI offers a very intuitive drag-and-drop interface for building reports and dashboards. The ribbon toolbar makes it easy to find visualizations, fields, and formatting options. With simple drag- and-drop gestures, users can create rich interactive reports. No advanced skills are needed! Tableau has an easy-to-use graphical interface as well but has a steeper learning curve than Power BI. While basic charts and graphs are simple enough, more complex visualizations require knowledge of the Tableau Desktop application. However, Tableau's visual best practices and Show Me tool make it easier for novices to get started. Winner: Power BI Data Connectivity Power BI can connect directly to a wide array of data sources both on-premises and in the cloud. These include SQL Server, Excel, on-premises analysis services, Azure services, Google Analytics, and more. The Power Query experience helps easily transform data before importing. Tableau also connects to a wide variety of data sources and allows multi-table connections. Data preparation requires knowledge of Tableau Desktop. Tableau may require more upfront work to shape data before analysis. Winner: Tie Visualization Capabilities Power BI provides a solid library of basic and advanced visualizations from bar, line, and pie charts to more complex visuals like tree maps, funnel charts, and gauges. Custom visuals can also be added from the AppSource store. Tableau offers the most robust visualization capabilities with an extensive library of highly interactive and customizable visuals. From heat maps to geographical mapping, Tableau makes it easier to represent complex data visually. Winner: Tableau
Sharing and Collaboration Power BI makes sharing dashboards and reports seamless. Users can easily publish reports to the Power BI cloud service and share with other users through a browser. Integration with Office 365 allows embedding dashboards in SharePoint and Teams. Tableau also offers flexible sharing options including ability to publish public or private to Tableau Server or Tableau Online. Users can interact with live dashboards in a browser but may require purchased server capacity. Winner: Power BI Scalability Power BI is highly scalable, supporting large complex datasets and high user volumes. With features like aggregations and incremental refresh, Power BI scales to meet the needs of large enterprises. The calculation engine can handle hundreds of millions of rows of data. Tableau is also built to support scaling to large data volumes and user bases, especially with Tableau Server. However, may require performance tuning and optimizations. Tableau also starts to slow down with very large complex models. Winner: Power BI Cost Power BI starts at $9.99 per user monthly for the Pro license which includes content sharing and collaboration features. Premium capacities can be added to scale to large workloads. Overall, Power BI offers a very competitive pricing model. Tableau pricing starts at $42 per user monthly for Viewer licensing and $70 for Explorers. Tableau Server licensing adds significant cost for sharing dashboards. Overall, Tableau carries a higher price tag making adoption more expensive. Winner: Power BI
Conclusion While both Power BI and Tableau are excellent BI platforms, when comparing the two tools head-to-head, Power BI comes out on top for its ease of use, sharing and collaboration features, scalability, and competitive pricing. Power BI makes an excellent choice for most businesses looking to adopt an enterprise-ready yet affordable BI platform. Many Power BI consulting companies recommend Power BI to their clients due to its robust features and favorable pricing.