Download
1 / 31
320 likes | 862 Views
... national data source on travel demand and travel behavior of the American public. ... Weekend and Holiday Travel Planning. Event Planning. Seasonal Resident ...

E N D
Slide 2:About the NHTS�
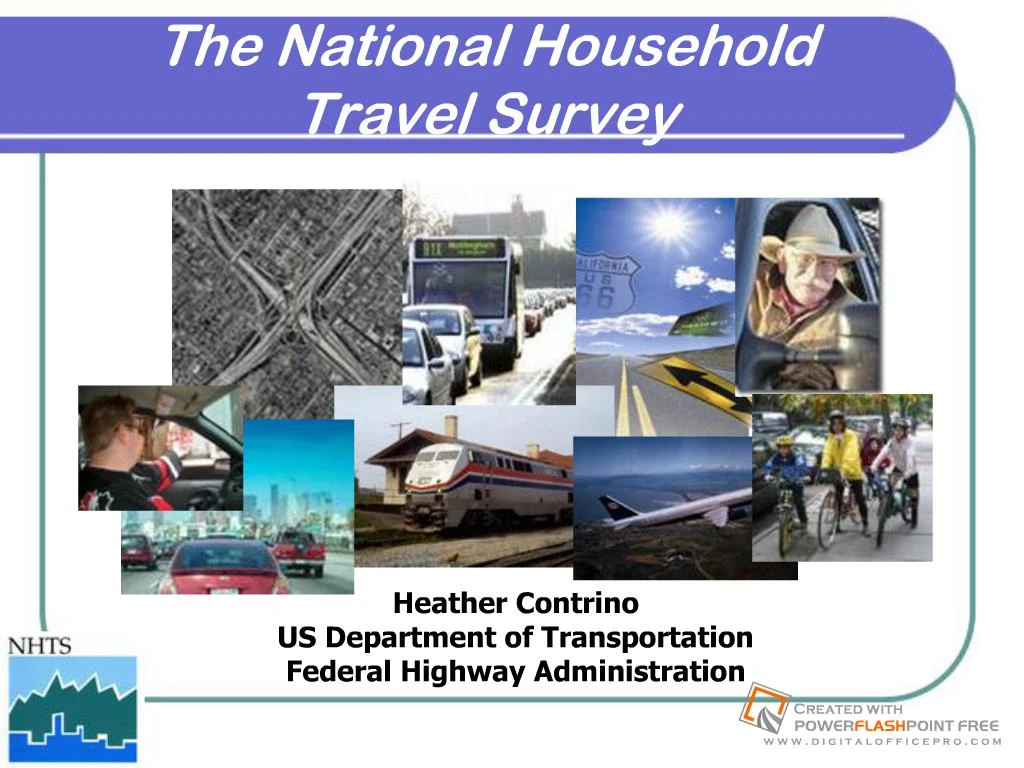
Only national data source on travel demand and travel behavior of the American public. Measures travel by US households for all modes and all purposes Survey conducted since 1969
Slide 3:NHTS uses a classic travel diary as a memory jogger�
Slide 4:And obtains trips from one address to another by all modes�
Slide 5:NHTS Core Data Content
Households Persons Geography Vehicles Trips Major Contribution Linkage between people, travel and vehicles
Slide 6:2008 NHTS provides trends over 40 years of core content�
Slide 7:New 2008 NHTS Content
Congestion Interstate use and tolling Telecommuting � opportunity and frequency Work arrival time and flexibility Safety Safe Travel to School Travel impacts of disability Energy and Environment Shopping by Internet and deliveries to the household Hybrid/Alternative fuel vehicles Fuel costs by vehicle type and travel behavior Intermodalism Access, egress, and travel party size Frequency of walk and bike Motorcycle ownership and use
Slide 8:The NHTS Program
National Study Serves the department, congress, and administration Resource for State and metropolitan areas (MPOs) and transportation community 40 years of trend data on U.S. travel behavior Sample size of 25,000 households Add-On Program Service to States and MPOs since 1990 Allows States and MPOs to purchase additional samples for their local area Program participation has doubled every survey year (Sample size of 125,000 households for 2008) 2008 NHTS Travel Data for 150,000 Households
Slide 9:2008 Add-On Program
125,000 Add-On Samples Florida DOT Georgia DOT South Carolina DOT North Carolina DOT Piedmont Region Virginia DOT New York State DOT Indiana DOT Omaha, Nebraska Cedar Rapids, IA Iowa DOT Maricopa, AZ Pima, AZ California DOT Wisconsin DOT Tennessee DOT Texas DOT South Dakota DOT Vermont DOT
2008 NHTS Schedule April 2009 - Data collection completed June 2009 - Final unweighted data for QA August 2009 - Add-On GIS files August 2009 � Draft final weighted file for QA October 2009 � Final weighted data and documentation Add-Ons receive final data January 2009 � Public use data set On-line analysis tool available for 2008 March 2009 � Final full documentation and users guideSlide 11: How can NHTS help you?
Base: NHTS data series, travelers 16+Slide 12:Identifying Trends in Demand
Huge growth in travel since 1969, however demand (number of trips) has leveled off over the past decade
Slide 13:Understanding Mode Use
Source: 2001 NHTS Purpose Distribution of Transit Trips
Slide 14:For interpreting and using JTW looking at mode loyalty:
Slide 15:Measure how access impacts behavior�
Source: NHTS series since 1969
Slide 16:Quantify the link between demographics and mobility
This is the daily range of travel for a low-income African American This is the daily range of travel for a high income African American
Slide 17:And demographics and safety�
Base: NHTS data on driver miles by age and FARS fatalities
Slide 18:See how the transportation system works together
Source: 2001 NHTS
Slide 19:And when and why people drive
Slide 20:To look at changes in the fleet mix�
Hybrid/Alternative Fuel Vehicles by State Source: NHTS 2008 preliminary
Slide 21:And forecast future demand
Estimated on current VMT/person from NHTS and Census population forecast
Slide 22: How other areas use the NHTS�
Slide 23:Safety Planning - California
Pedestrian Fatalities per Mile of Exposure Source: 2001 FARS pedestrian Fatalities and NHTS 2001 miles walked I will now highlight some current and future uses of NHTS at the state level.I will now highlight some current and future uses of NHTS at the state level.
Slide 24:Model Calibration - Wisconsin
HBW Observed Vs Predicted Trip Length Frequency Source: 2001 NHTS Bruce Aunet, WI DOT & Cambridge Systematics Inc. NHTS is a vital component in validating home based work trip length distributions by time of day. Typically model based distributions are modeled against NHTS based observed distributions. Note that NHTS provides HBW, NHB, HBO.NHTS is a vital component in validating home based work trip length distributions by time of day. Typically model based distributions are modeled against NHTS based observed distributions. Note that NHTS provides HBW, NHB, HBO.
Slide 25:Air Quality - New York
Vehicle Starts, Trip Lengths by Time of Day and Vehicle Utilization Source: 2001 NHTS New York uses NHTS data by examining cold starts and hot starts by time of day to estimate Carbon Monoxide and Heavy Metals emissions. New York used NHTS in a variety of ways. Some uses are: Metropolitan Level Analysis reports Compare metro areas in New York. Comparison Studies Are New York State residents different from those elsewhere with respect to personal mobility? To what extend do the travel patterns of New York State residents skew the overall patterns in the state? Do New York State residents outside of New York City travel differently from the rest of the nation? New York uses NHTS data by examining cold starts and hot starts by time of day to estimate Carbon Monoxide and Heavy Metals emissions. New York used NHTS in a variety of ways. Some uses are: Metropolitan Level Analysis reports Compare metro areas in New York. Comparison Studies Are New York State residents different from those elsewhere with respect to personal mobility? To what extend do the travel patterns of New York State residents skew the overall patterns in the state? Do New York State residents outside of New York City travel differently from the rest of the nation?
Mode Trip Length Distribution Trips by time of day Source: 2001 NHTS Performance Measures - VirginiaSlide 27:Special Studies - Florida
Hurricane Evacuation Planning Weekend and Holiday Travel Planning Event Planning Seasonal Resident Impact
Slide 28:NHTS Products
State Profiles Policy Briefs Trends Database Transferability On-line Analysis Tool Risk Assessment Tool AAA Traffic Safety Foundation NHTS Trends CD-ROM
Slide 29:Accessing NHTS Products
State Profiles Policy Briefs: http://ornl.gov/publications.shtml#issueBriefs Trends Database: To be posted soon Transferable data for trip generation http://fmip.ornl.gov/nhts/ Risk Assessment Tool: http://www.aaafoundation.org/trafficSTATS/ On-line Analysis Tool: http://nhts.ornl.gov SAS Data Set: http://nhts.ornl.gov/download.shtml Contact Heather Contrino, FHWA
Thank You! Heather Contrino Heather.Contrino@dot.gov Future Program Goals Methods Coverage and Response Rates Cellular phones and non-contacts Periodicity Real time reporting environment Continuous study design/annual reporting Relevant Content Establishing regular, reliable performance measures Maintaining trends while addressing new policy and planning questions