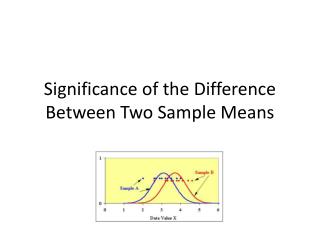
Download
1 / 46
460 likes | 916 Views
Biostatistics course Part 9 Comparison between two means. Dr. Sc Nicolas Padilla Raygoza Department Nursing and Obstetrics Division Health Sciences and Engineering Campus Celaya-Salvatierra University of Guanajuato, Mexico. Biosketch. Medical Doctor by University Autonomous of Guadalajara.

E N D
Biostatistics course Part 9Comparison between two means Dr. Sc Nicolas Padilla Raygoza Department Nursing and Obstetrics Division Health Sciences and Engineering Campus Celaya-Salvatierra University of Guanajuato, Mexico
Biosketch Medical Doctor by University Autonomous of Guadalajara. Pediatrician by the Mexican Council of Certification on Pediatrics. Postgraduate Diploma on Epidemiology, London School of Hygine and Tropical Medicine, University of London. Master Sciences with aim in Epidemiology, Atlantic International University. Doctorate Sciences with aim in Epidemiology, Atlantic International University. Professor Titular A, Full Time, University of Guanajuato. Level 1 National Researcher System padillawarm@gmail.com
Competencies • The reader will apply a Z test to inferences from a comparison of two paired means. • He (she) will apply a Z test to inferences from two independent means. • He (she) will apply t test to inferences from a mean of differences in a small sample. • He (she) will apply a t test to inferences for two independent means in a small sample. • He (she) will obtain a confidence interval for two independent means and for a mean of differences.
Introduction • Often we want to compare two groups. • The statistical methods used for the comparison of two means depends on how these means were obtained. • The data can be obtained from paired or not paired samples.
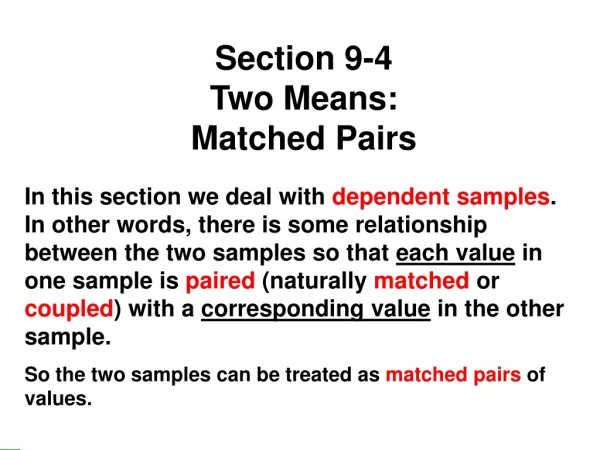
Paired data • How to obtain paired data? • Paired samples occur when first measure is matched with a second measure in the same subject. • For quantitative data usually occurs when there are repeated measurements on the same person.
Example • In a study to determine whether birth weight measurements are adequate, we compared the birth weight of newborns from a hospital in Celaya, Gto. • The measurements were performed by different people, to control the measurement bias, being an observer blinded to the measurement of another observer.
Non-paired data • How to obtain non-paired data? • We get non-paired data when observations in a sample are independent from observations in another sample.
Example • To study the effects of a new drug to treat the parasitic burden of Ascaris lumbricoides, patients were randomized to receive nitazoxanide (group A) and albendazole (group B). • The effect of the drug in each group was measured and compared. • In the analysis of paired data we calculate the difference between the first and second measurement. This gives us a sample of differences, and then apply the methods of analysis for quantitative data from one mean.
Analysis of quantitative paired data • When analyzing paired data, you must first calculate the difference between two measurements in the same subject. • We measurement birth weights of newborns in Celaya, by two observers.
Analysis of quantitative paired data • To assess the difference in paired measurements we can calculate the mean differences and confidence intervals; we can also calculate whether the mean of the differences is significantly different from 0. • The notation that we use to indicate the mean of differences and standard deviation in the sample and the population are displayed:
Confidence interval • If there is no difference between the paired measurements, the average of the differences will be 0. • To calculate the confidence interval of the mean of the differences in the sample and test the hypothesis that is equal to 0, we need to know: • The mean differences • The standard deviation of differences • The standard error of the mean of the differences.
Confidence interval • We can estimate the confidence interval around the mean of the differences in the sample in the same way as we did for one mean. • The confidence interval at 95% tells us that we have 95% confidence that the true mean of differences in the population is between the confidence interval 95% to the sides of the mean of differences of the sample.
Confidence interval • The general formula for confidence interval 95% is: • Estimate of the sample ± 1.96 X SE of the estimate of the sample • Then the confidence interval 95% for the mean of the differences is: • δ + 1.96 x (s (δ) / √ n) • δ is the mean of the differences. • 1.96 is the multiplier used to calculate the confidence interval at 95%. • If it is calculated at 90% using 1.64 as a multiplier.
Example • Confidence interval 95% • d of birth weights = -34.0 • s= 140.94 • SE= 140.94/√10=44.60 • -34±1.96 (44.60) = -121.42 a 53.42
Example • Confidence interval 90% • d of birth weights = -34.0 • s= 140.94 • SE= 140.94/√10=44.60 • -34±1.64 (44.60) = -107.14 a 39.1
Hypothesis test for a mean of differences • A confidence interval gives us a 95% range to the sides of the mean of the differences that we have confidence in 95% of times that it includes the mean of differences in the population. • We can also calculate the probability that, on average, there is no difference between the paired observations in the population, using a hypothesis test.
Hypothesis test for a mean of differences • The null hypothesis is that the mean differences in the population is zero: Ho: δ = 0 • This is equivalent to say that the distribution of mean of differences in the sample is Normal with mean 0 and a standard error that depends on the standard deviation of the difference in the population. • The alternative hypothesis is that the mean of the difference in population is not zero: Ha: δ ≠ 0
Hypothesis test for a mean of differences • Test hypothesis: • To test null hypothesis, we calculate Z test Mean of differences of the sample - mean of the difference of hypothesis d - 0 z = ----------------------------------------------------- = ------------ standard error of the mean of the ES(d) differences if the sample • Where the mean of differences of hypothesis is zero.
Hypothesis test for a mean of differences • Calculate the value of z in the hypothesis test, tells us how many standard errors of the mean observed is the center of the distribution, defined by the null hypothesis. δ - 0 Z= ----------------- S(δ) /√n
Example • We have seen that the mean of differences in weight in 10 babies was -34, with s = 140.9 and confidence intervals at 95% -121.42 to 53.42 gr. • We want to find out if the measurements taken by the two observers were really different.
Example • We should note the null hypothesis: • “In average, all possible measurements taken by two observers arte equal” or • Mean of the differences in the population is zero. • Alternative hypothesis will be: the mean of the differences in the population will no be zero.
Example -34 – 0 To test hypothesis, we calculate z = ----------- = - 0.76 44.60 • Assuming that the mean of the differences is normally distributed with mean zero, the test result said that mean of differences estimate is -0.76 standard errors from the center of the distribution. • Referring the Z value of -0.76 in tables for two tails of Normal distribution, the p-value is 0.44. • The conclusion is that we accept the null hypothesis and say the sampling variation is a likely explanation for the mean of differences.
How obtain the p-value • In the table of distribution Z or Normal, we search the Z value obtained with our test and see in the column on the right, the corresponding p-value. • This table can be found in textbooks of Biostatistics.
Small paired samples • When the sample size is small, the distribution of samples is not exactly Normal, but the follow the t distribution. • Therefore, if the sample size is small (less than 50) we use the values of the t distribution for calculating the confidence interval and hypothesis test.
Confidence interval for paired sample • Formulae for 95% confidence interval is estimate ± t0.05 (ES) • Where estimate is the mean of differences • t0.05 is the value of t distribution to 0.05 of p with n-1 degree of freedom. • The first column from t distribution is the degrees of freedom corresponding to n-1. We go on the right until the value of 0.05 and that is the multiplier used for the confidence interval.
Hypothesis test for small paired samples • The formulae for hypothesis test is: t = mean of differences – 0 /SE • The formulae is similar that Z test, only that the result, to obtain the p-value, is search in the table of t distribution. • The first column is degree of freedom (n-1) and it is search on the right the t value and in top of the column see the p-value.
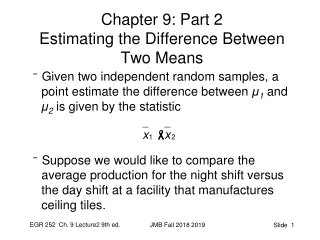
Analysis of independent samples • Differs from the analysis of paired data, as we observe the difference between two independent means rather than the mean of the difference of two paired observations. • Examples • Do smokers have a different blood pressure than non-smokers? • In a sample of smokers and non-smokers: • Systolic blood pressure averaged 148 and 138 non-smokers. • The difference in average is 148-138 = 10.
Analysis of independent samples • Notation: • We are observing two independent populations and it is needed two samples, we need additional notations. As shown in the table below: • Remember that we use Greek letters for population parameters and Latin letters for the sample estimates: • The lower numbers serve to distinguish between sample 1 and sample 2, and between populations 1 and 2. Population Sample 1 2 1 2 _ _ Mean μ1 μ2 X1 X2 Standard deviation σ1 σ2 s1 s2
Sampling distribution for two independent samples • The sampling distribution of the difference between two independent means is found using the same procedures used for a single sample. • Repeatedly took random samples of size n1 and size n2 and each time, we calculated the means (x1, x2) and standard deviations (s1, s2) in both populations and then measure the difference between the means for each pair of samples. • The result is a sampling distribution of differences between two independent means.
Sampling distribution for two independent samples • Generating this distribution we see that: 1 .- The mean of the sampling distribution is the value of the population, which is the difference between the two means in the population. 2 .- The standard deviation of the sampling distribution depends on n1 and n2, which are the sample sizes. 3 .- The shape of the distribution becomes closer to Normal when n1 and n2, are increasing. • We know that the sampling distribution of any estimate of the sample can be inferred from the data collected from only one sample. • The same principles apply here: the sampling distribution of difference of means can be inferred from only one group of two samples. To do this, we need: • The difference between the two means from the samples • The standard error of the difference between the two means from the samples
Standard error for the distribution of differences of means • The standard error of the difference between two independent means is the combination of the standard errors of two independent sampling distributions. • We know that the standard error for half of the sample is: s SE = -------- √ n • Variance of the mean is the square of standard error: Variance = σ2 / n
Standard error for the distribution of differences of means • One can show that the variance of two independent means is equal to the sum of the variances of the two averages of samples as: σ1 σ2 SE (X1) = ------- SE (X2) = -------- n1 n2 _ _ σ21 σ22 Variance (X1 –X2) = variance of X1 + variance of X2 = --------- + ------- n1 n2 • The variances are coupled because each sample contributes to sampling error of the distribution of differences. • Then, the standard error of the difference between two independent samples is given by: σ21 σ22 SE (X1 – X2) = √ ------- + ------ n1 n2
Standard error for the distribution of differences of means • In most situations we do not know the standard deviations of the population (σ1 and σ2), in the practice, we use the standard deviations of the sample (s1 and s2) so that: s21 s21 SE(X1 – X2) = √ ------- + --------- n1 n2
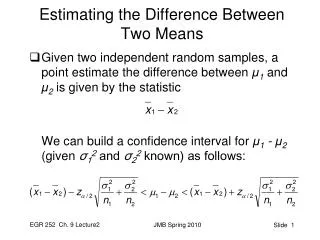
Confidence interval for the difference of two means • Assuming that the sampling distribution of (X1 – X2) is Normal, we can calculate confidence interval for the difference of two means using the formulae general: Difference of means ± 1.96 (ES (X1 –X2)) • For a 95% confidence interval, assuming Normal distribution: _ _ (X1 – X2) ± 1.96 [√(s21 / n1) + (s21 / n2)]
Example • In a study to evaluate the efficacy of oral rehydration solution (ORS) in children with acute diarrhea, 40 children were in the treatment group and 40 children in the control group. We measured the duration in hours of diarrhea and its standard deviation. Group n Mean duration of diarrhea s Treatment 40 72 10 Control 40 120 12
Example • To calculate confidence interval 95% for the difference between means of independent samples, we need to calculate difference between means and standard error: _ _ X1 – X2 = 72 – 120 = - 48 hours s21 s22 102 122 ES(X1 – X2) = √ -----+ ----- = √------ + ---- =√2.5+3.6 = 2.47 n1 n2 40 40 95% IC = -48 ± 1.96 (2.47)= - 52.84 a – 43.16
Example • The difference from means was -48 hours with an standard error of 2.47. • Confidence interval 95% say us that we have 95% of confidence that the difference between means of duration of diarrhea in the population is between -52.8 hours and -43.16 hours. • The interval does not include the unit, we can say that the difference of means is significant statistically.
Hypothesis test for two independent means • To calculate probability (p-value) that two independent means are equal. We use Z test to probe hypothesis. • We used the Z test in the same form, that in did in mean of the differences in paired samples: • Null hypothesis is that the two means are equal: Ho: μ1 – μ2 = 0 • Alternative hypothesis is: H1: μ1 - μ2 ≠ 0 • Then, the formulae for Z test is: _ _ (X1 – X2) - 0 z = ------------------ ES(X1 –X2) ES (X1 –X2) = √(s21 /n1) + (s21 /n2)
Example • To apply the hypothesis test in the study of oral rehydration solution, of the duration of diarrhea is in average the same for the two groups. • Differences from means is - 48 hours. Standard error is 2.47. - 48 - 0 Z = ----------- = - 19.43 2.47 • This say us that the observed difference is -19.43 standard errors from the center of distribution (0). • P-value, for z= -19.43 is <0.0001 • If it does not having difference in duration of diarrhea, should having a small opportunity (p<0.0001) of observe an extreme difference as observed. • We can say that it is more probable that the means are different; difference in mean in the group with ORS comparing with control group, are different statistically.
Small samples with two independent samples • When comparing two independent samples that are small, we use the t distribution instead of the Normal distribution to calculate confidence intervals and test hypotheses. • The procedure is similar to that we used data from a sample, with one exception: when calculating the standard error. • The common variance: • With small samples, we estimate a common variance using data from two independent samples. Is the average of the two variances: (n1 – 1)s21 + (n2 -1)s21 S2 = --------------------------- (n1 – 1) + (n2 -1)
Small samples with two independent samples • Standard error of the difference of means in the samples is: SE(X1-X2) = s x √1/n1 + 1/n2
Example • In a study for the treatment of iron deficiency anemia, with two different types of iron, were randomized the students in a village school, to receive either treatment. • Initially, the levels of hemoglobin (HB) in g / dl. were similar in both groups. • After 3 months of treatment were measured the levels of HB.
Example Hemoglobin n Mean (g/Dl.) s Iron A 15 14.8 0.5 Iron B 13 12.1 1.1 Confidence interval 95% = difference of means ± multiplier t0.05 x SE Multiplier t0.05 with n-2 degree of freedom = 2.056 S2 = (15-1)0.52 + (13 -1)1.12 /15-1 + 13-1 =3.5 +14.52/26 = 18/26 =0.69
Example Hemoglobin n Mean (g/Dl.) s Iron A 15 14.8 0.5 Iron B 13 12.1 1.1 Confidence interval 95% = 14.8 - 12.1 ± 2.056 x 0.32 SE = s √1/n1 + 1/n2 = √0.69 x√1/15 + 1/13= 0.83 x 0.379 = 0.32 CI95% = 2.7± 0.66 =2.04 a 3.36
Example Hemoglobin n Mean (g/Dl.) s Iron A 15 14.8 0.5 Iron B 13 12.1 1.1 Ho: µ1=µ2 o µ1-µ2= 0 HA: µ1≠µ2 o µ1-µ2≠ 0 t= (14.8 - 12.1)-0 / 0.32 = 8.44 df n-2 = 26 p<0.05
Bibliografía • 1.- Last JM. A dictionary of epidemiology. New York, 4ª ed. Oxford University Press, 2001:173. • 2.- Kirkwood BR. Essentials of medical statistics. Oxford, Blackwell Science, 1988: 1-4. • 3.- Altman DG. Practical statistics for medical research. Boca Ratón, Chapman & Hall/ CRC; 1991: 1-9.