Download
1 / 30
350 likes | 1.26k Views
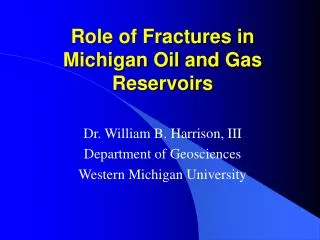
Overestimation of OGIP in water-Drive gas reservoirs due to a misleading linear p/z plot. M.H. El-Ahmady, R.A. Wattenbarger, Texas A&M University, and T.T. Pham, El-Paso Production Company June 13, 2001. Outline of Presentation. The uniqueness problem.

E N D
Overestimation of OGIP in water-Drive gas reservoirs due to a misleading linear p/z plot M.H. El-Ahmady, R.A. Wattenbarger, Texas A&M University, and T.T. Pham, El-Paso Production Company June 13, 2001
Outline of Presentation • The uniqueness problem
p/z plot for a volumetric reservoir p/z OGIP Gp
Effect of water-drive on p/zplot p/z OGIP Gp
What is the OGIP? p/z False straight line OGIP G’ Gp
Non-Uniqueness Problem Early data may indicate - (a) large OGIP with no water influx or(b) smaller OGIP with water influx
Outline of Presentation • The uniqueness problem • A Field example
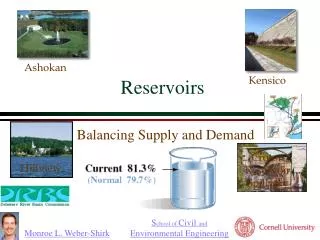
Field A (Gulf Of Mexico) • Early production data shows OGIP = 270 Bscf without water drive • Aquifer analysis showsOGIP = 110 Bscf with water drive
Field A (Gulf Of Mexico) After more production: • p/z showed lower OGIP • One well “watered out” • The current estimate of OGIP is 120 Bcf , close to the early aquifer analysis (110 Bcf)
Outline of Presentation • The uniqueness problem • A Field example • Simulation, const. prod. rate
Outline of Presentation • The uniqueness problem • A Field example • Simulation, const. prod. rate • Simulation, false straight line
What rates cause the false straight line? (simulation) • We give a value of G’ • Assume constant production rate for the first 6 months • p/z plot gives a perfect straight-line after 6 months.
Simulation of false straight line p/z False straight line OGIP G’ Gp
Outline of Presentation • The uniqueness problem • A Field example • Simulation, const. prod. rate • Simulation, false straight line • Conclusions
Conclusions • At very early times, the p/z plot extrapolates to the correct OGIP, even with water drive. (However, this is probably not practical because of data errors and lack of data at very early times).
Conclusions • A false linear p/z plot may occur for a particular production rate schedule. This makes it impossible to determine OGIP with this rate schedule.
Conclusions • The “non-uniqueness” production rate schedule generally increases, then peaks and decreases.
Overestimation of OGIP in water-Drive gas reservoirs due to a misleading linear p/z plot M.H. El-Ahmady, R.A. Wattenbarger, Texas A&M University, and T.T. Pham, El-Paso Production Company June 13, 2001